General and user interface functions#
Starting and calling the socket server#
A running socket server is critical for the use of XlCalcNet from Microsoft Excel.
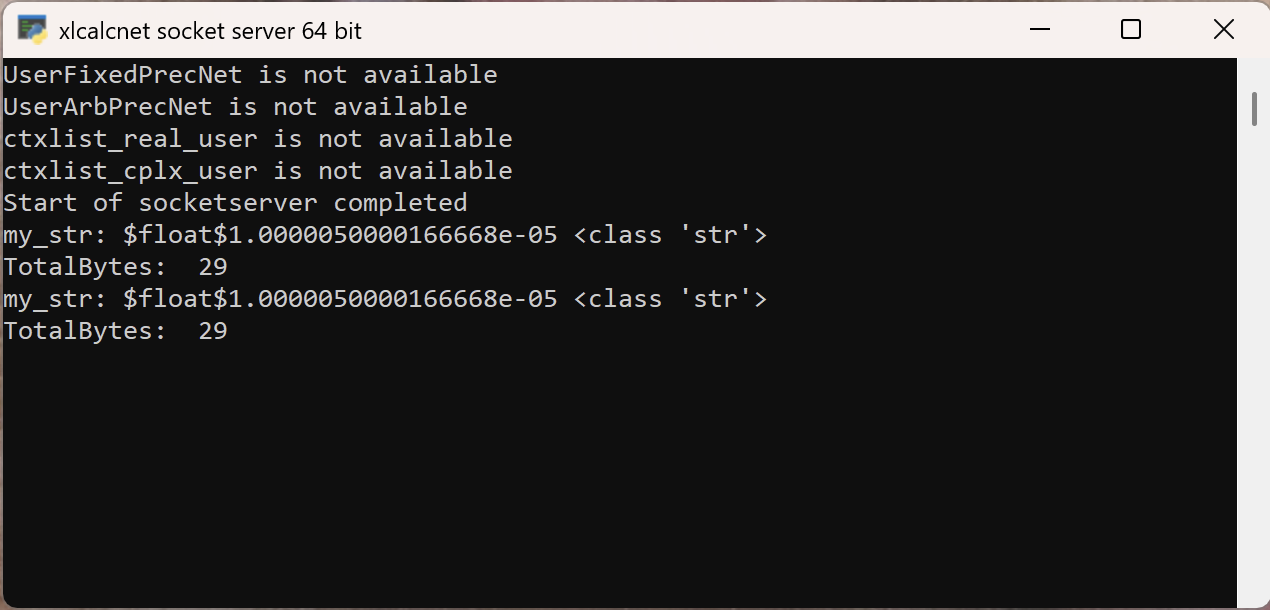
The socket server can be startet in various ways:
Starting the socketserver from the TinyIDE or GalleryOfPlots application#
Explain use of menu.
Starting the socketserver programmatically from Python#
- gui.socketserver()#
Describe the start of the socket server
>>> from xlcalcnet import gui
>>> gui.socketserver()
Calling the socketserver from Python#
Describe calling the socketserver from Python
>>> import socket

>>> host = socket.gethostname()
>>> port = 11958  # socket server port number
>>> client_socket = socket.socket()  # instantiate
>>> client_socket.connect((host, port))  # connect to the server

>>> client_socket.send(SnippetToSend.encode())  # send message
>>> DataReceived = client_socket.recv(1024).decode()  # receive response
>>> print('Received from server: ' + DataReceived)  # show in terminal

>>> client_socket.close()  # close the connection
Calling the socketserver from C##
Describe calling the socketserver from C#
Source code#
The Python source code for the socketserver can be found here: duhadler/XlCalcNet
The C# source code for the socket client can be found here: duhadler/XlCalcNet
Starting the output monitor#
- gui.outputmonitor()#
Describe the start of the output monitor
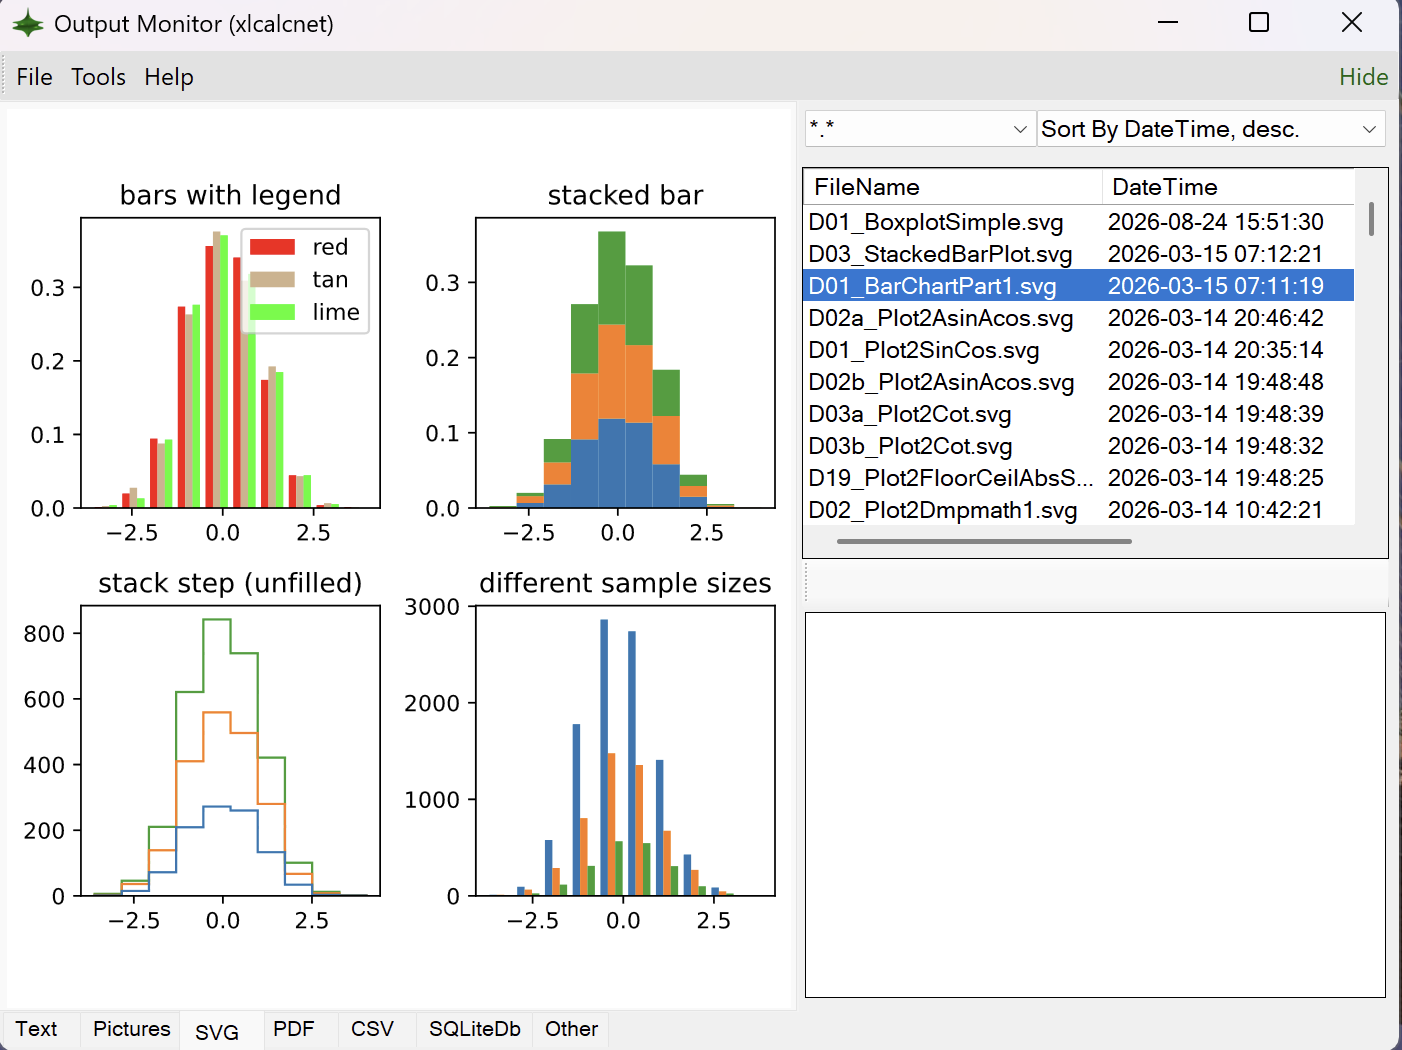
The Python source code for starting the output monitor can be found here: duhadler/XlCalcNet
The C# source code for the output monitor can be found here: duhadler/XlCalcNet
>>> from xlcalcnet import gui
>>> gui.outputmonitor()
Starting an additional instance of the IDE#
- gui.tinyide()#
Describe the start an additional instance of the IDE
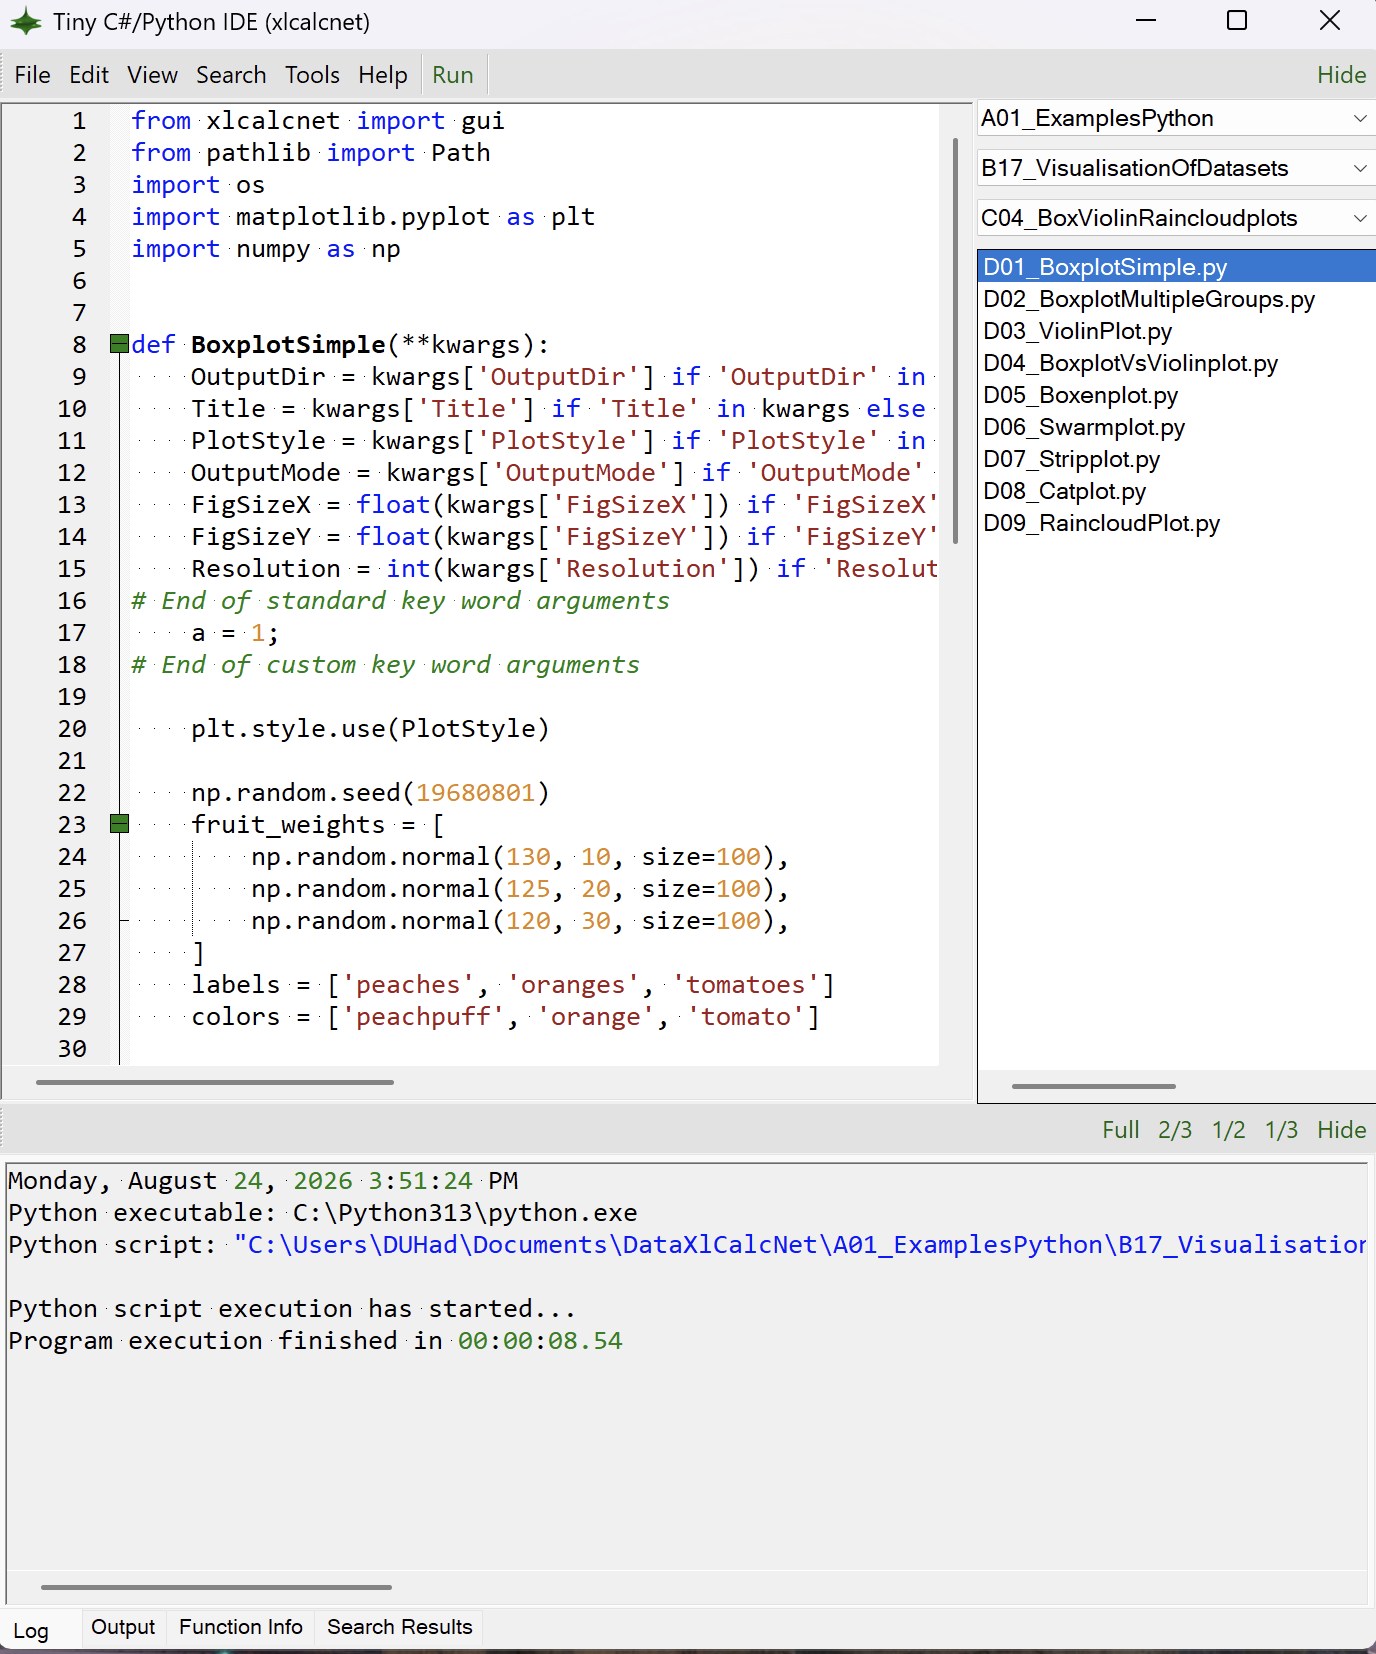
The Python source code for starting the IDE can be found here: duhadler/XlCalcNet
The C# source code for the IDE can be found here: duhadler/XlCalcNet
>>> from xlcalcnet import gui
>>> gui.tinyide(x)
Starting the gallery of plots#
- gui.plot2d()#
Describe the start of the gallery of plots
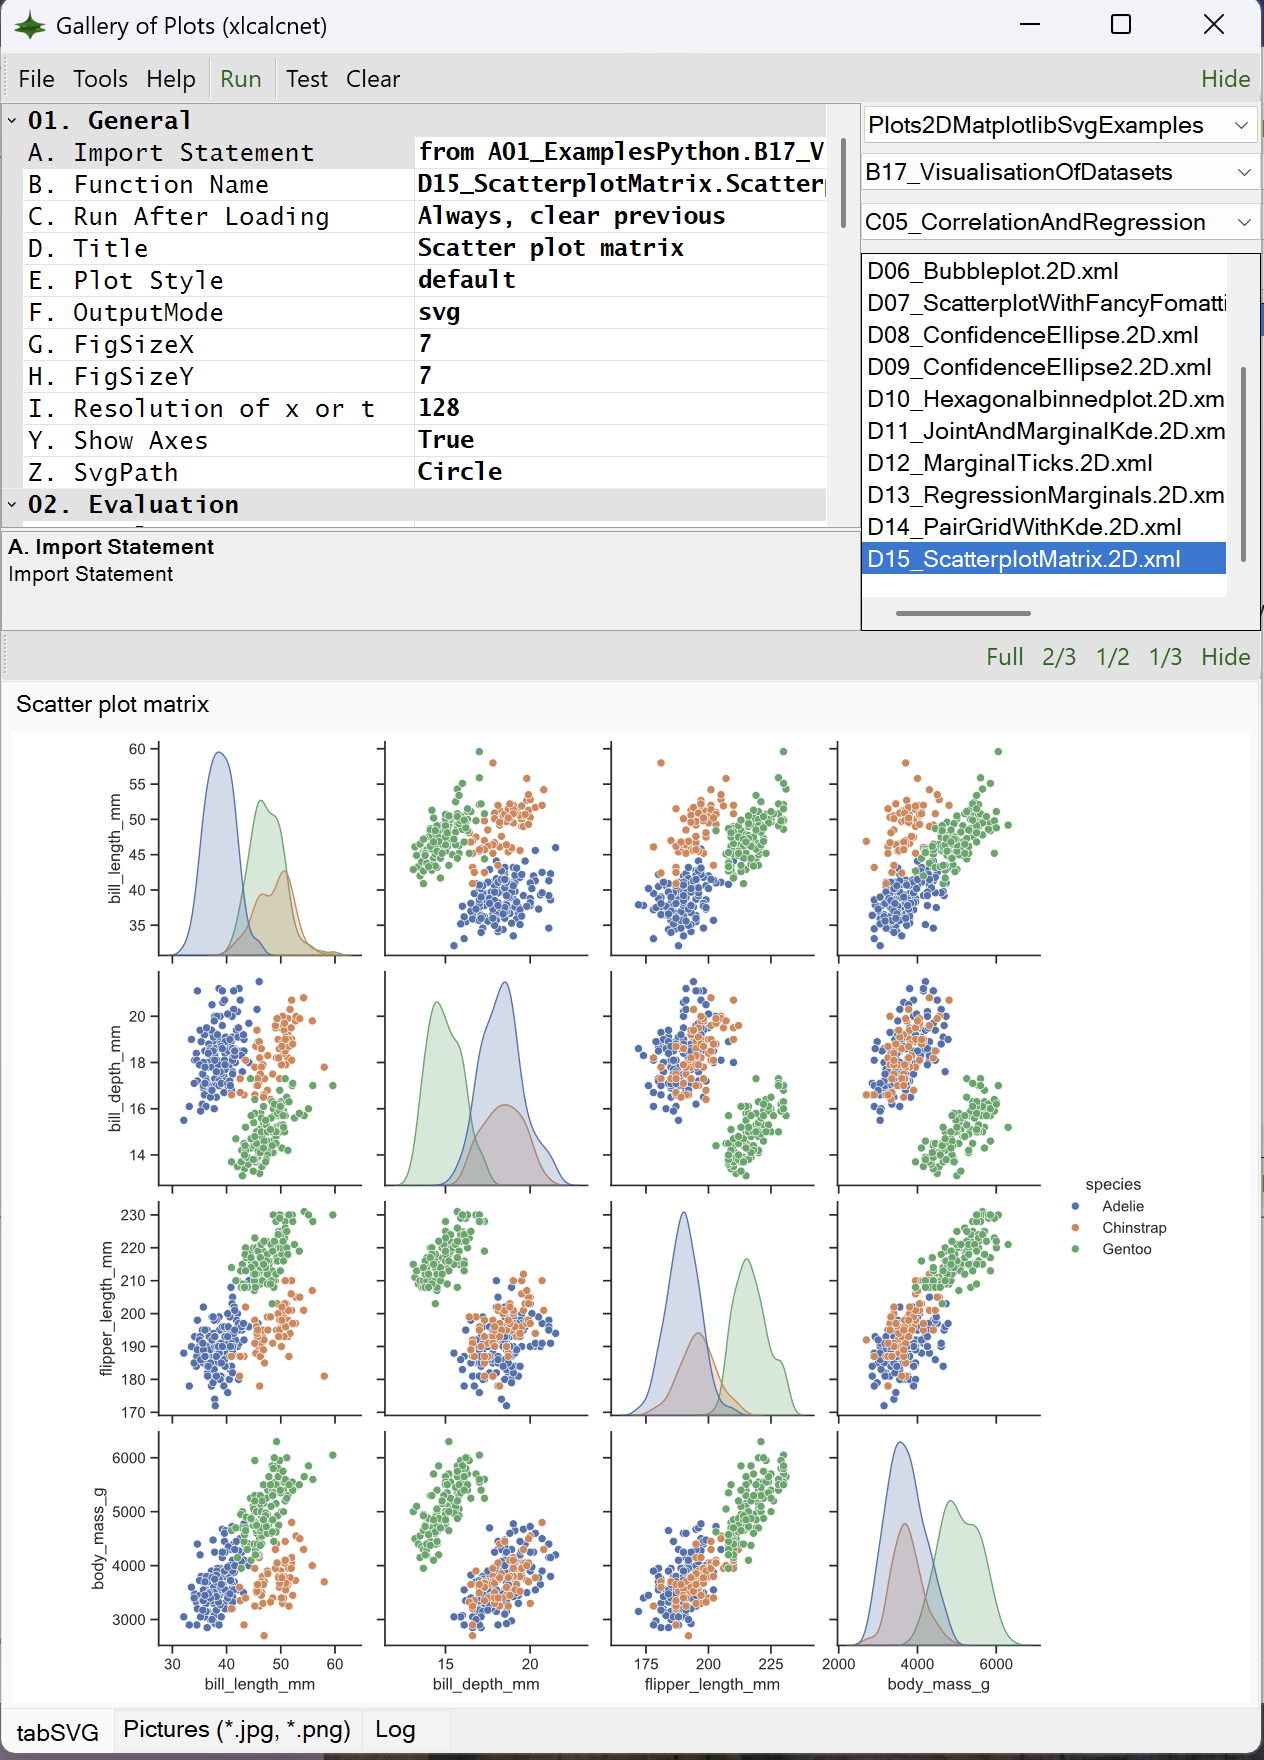
The Python source code for starting the IDE can be found here: duhadler/XlCalcNet
The C# source code for the gallery of plots can be found here: duhadler/XlCalcNet
>>> from xlcalcnet import gui
>>> gui.plot2d(x)
Starting the interactive 3D wpf plots#
- gui.plot3d()#
Describe the start of Interactive 3D Wpf plots
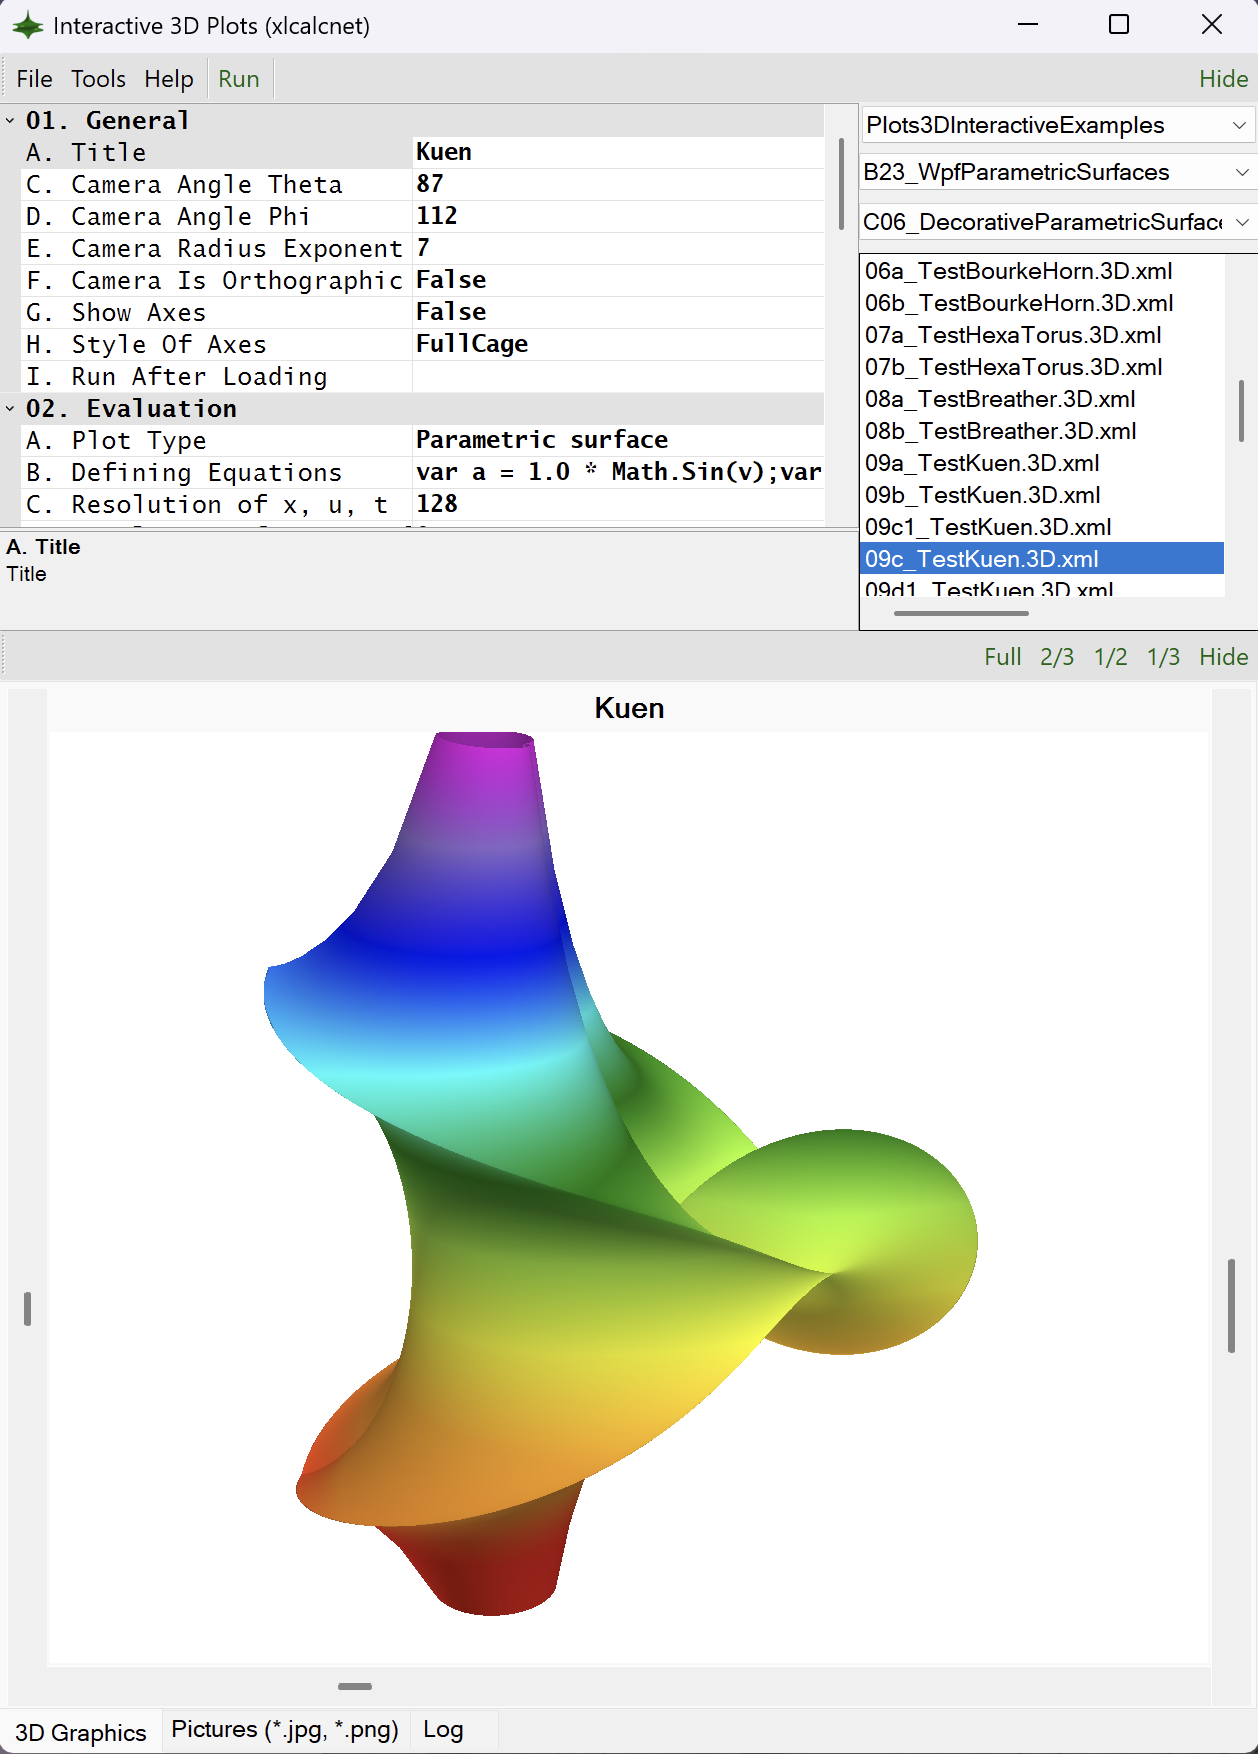
The Python source code for starting the interactive 3D wpf plots can be found here: duhadler/XlCalcNet
The C# source code for the gallery of plots can be found here: duhadler/XlCalcNet
>>> from xlcalcnet import gui
>>> gui.plot3d(x)
Starting the data viewer#
- gui.dataviewer()#
Describe the start of data viewer
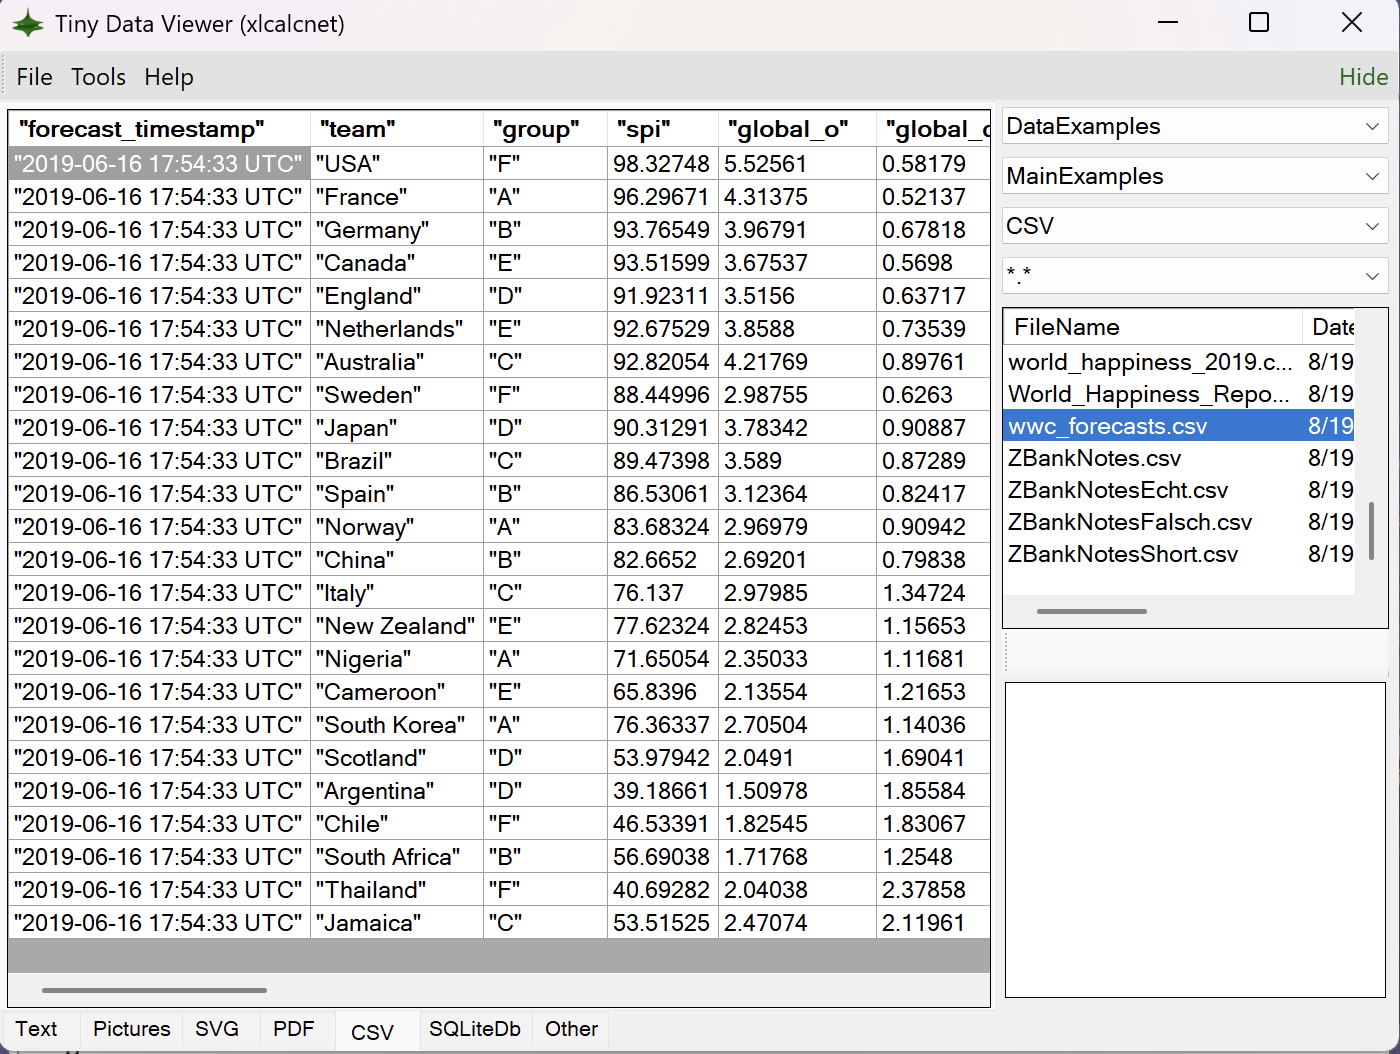
The Python source code for starting the data viewer can be found here: duhadler/XlCalcNet
The C# source code for the data viewer can be found here: duhadler/XlCalcNet
>>> from xlcalcnet import gui
>>> gui.dataviewer(x)
Starting IDLE#
- gui.idle()#
Describe the setup and use of IDLE
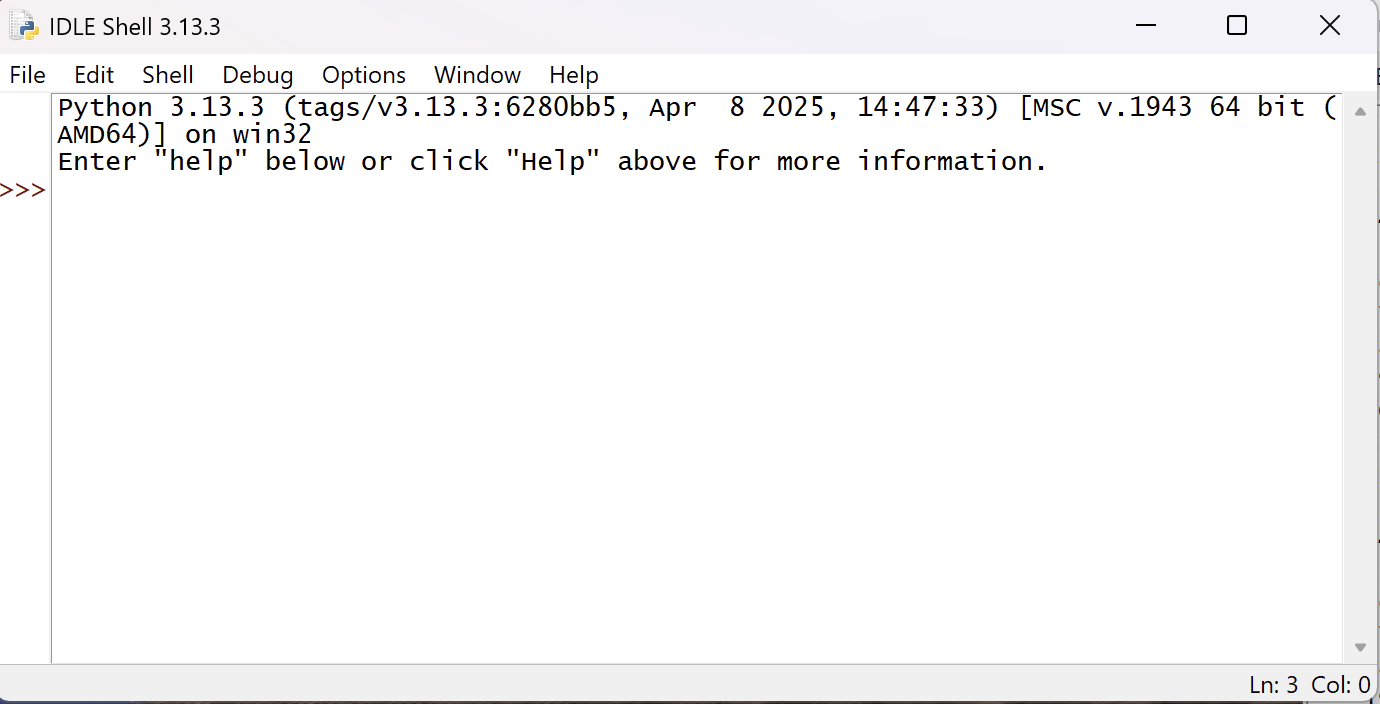
The Python source code for starting the data viewer can be found here: duhadler/XlCalcNet
The C# source code for the data viewer can be found here: duhadler/XlCalcNet
>>> from xlcalcnet import gui
>>> gui.idle(x)
Information about installation status of supporting python packages#
- gui.info()#
Support for Matplotlib output in a separate process
>>> from xlcalcnet import gui
>>> gui.info()
- gui.has_gpm()#
Returns True if gmpy2 is installed
>>> from xlcalcnet import gui
>>> gui.has_gpm()
- gui.has_apm()#
Returns True if python-flint is installed
>>> from xlcalcnet import gui
>>> gui.has_apm()
- gui.has_xlcalcnet2()#
Returns True if xlcalcnet2 is installed
>>> from xlcalcnet import gui
>>> gui.has_xlcalcnet2()
Information about context lists, and setting global precision#
- property gui.ctxlistreal#
Returns a list of all available numerical contexts supporting real data types
>>> from xlcalcnet import gui
>>> gui.ctxlistreal
- property gui.ctxlistcplx#
Returns a list of all available numerical contexts supporting complex data types
>>> from xlcalcnet import gui
>>> gui.ctxlistcomplex
- gui.setdps(dps)#
Sets the decimal precision for all multiprecision data types
>>> from xlcalcnet import gui
>>> dps = 50
>>> gui.setdps(dps)
Support for running interactive Matplotlib output in a separate process#
There is support for Matplotlib output in a separate process
See also: https://matplotlib.org/stable/users/explain/figure/interactive.html#default-ui
- property gui.plot(fig, file, fname)#
Support for Matplotlib output in a separate process
>>> from xlcalcnet import gui
>>> gui.plot(fig, file, fname)