Line and lollipop charts#
Line chart (Seaborn)#
The Python code for the example below can be found online in the DataXlCalcNet repository or in the corresponding local DataXlCalcNet folder in the file D01_LineChartSeaborn.py, and the XML code in the file D01_LineChartSeaborn.2D.xml.
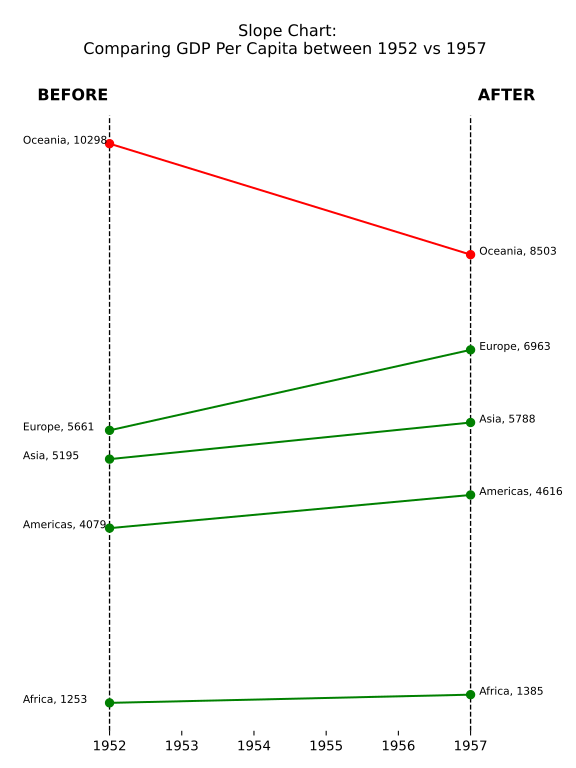
Slope Chart#
The Python code for the example below can be found online in the DataXlCalcNet repository or in the corresponding local DataXlCalcNet folder in the file D02_SlopeCharts.py, and the XML code in the file D02_SlopeCharts.2D.xml.
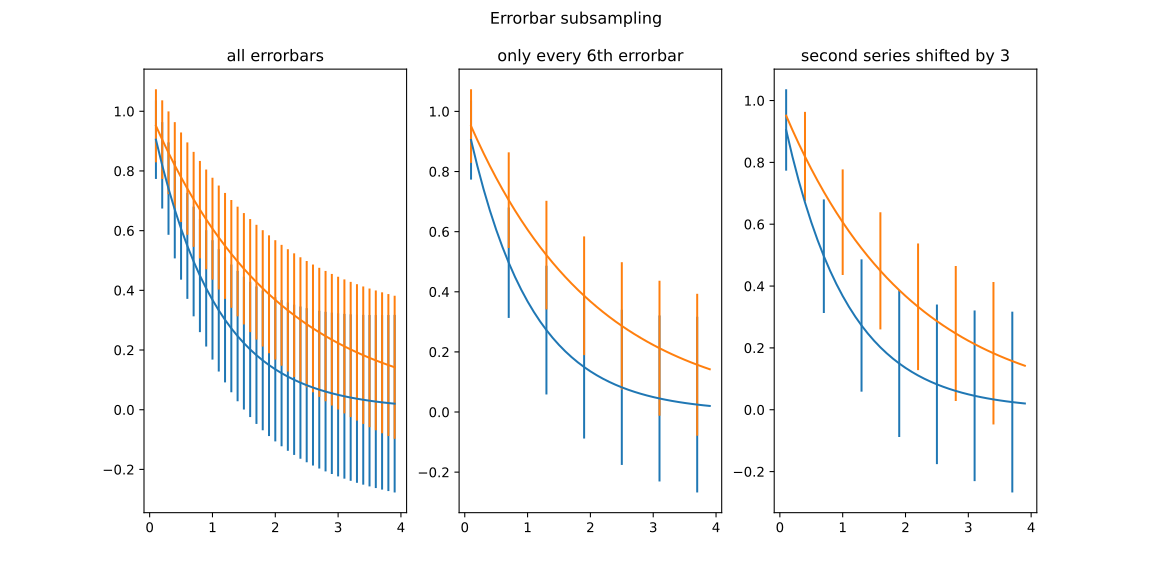
Line chart with error Bar#
The Python code for the example below can be found online in the DataXlCalcNet repository or in the corresponding local DataXlCalcNet folder in the file D03_LineErrorBars.py, and the XML code in the file D03_LineErrorBars.2D.xml.
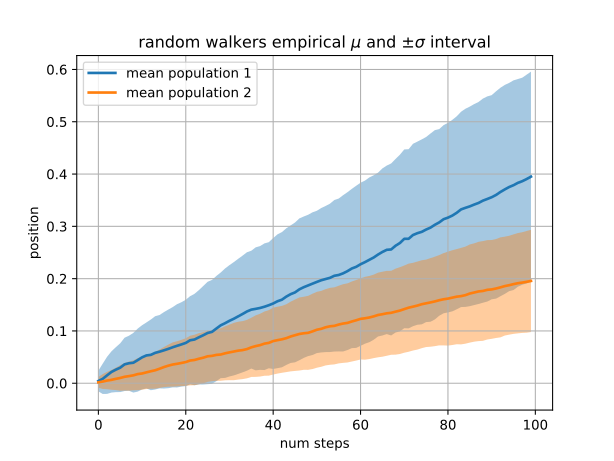
Confidence band (RandomWalk)#
The Python code for the example below can be found online in the DataXlCalcNet repository or in the corresponding local DataXlCalcNet folder in the file D04_ConfidenceBand_RandomWalk.py, and the XML code in the file D04_ConfidenceBand_RandomWalk.2D.xml.
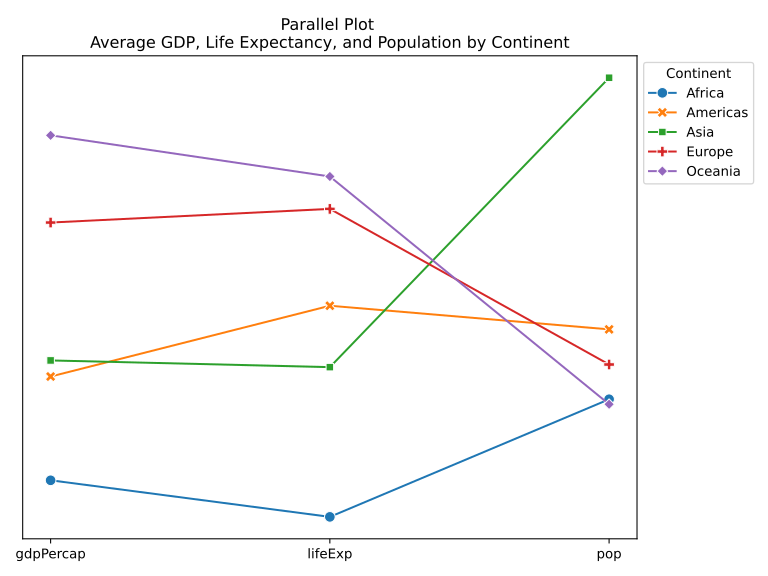
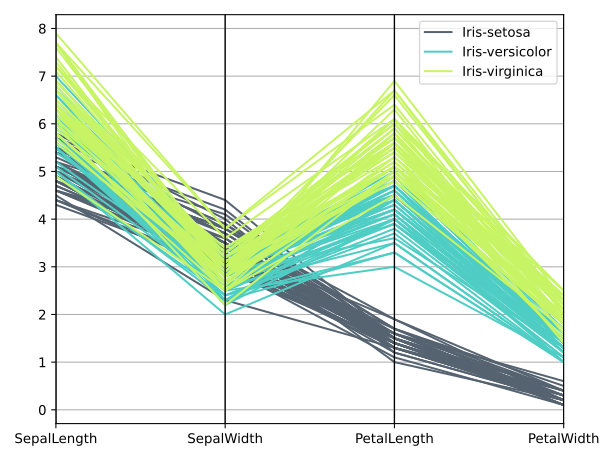
Plotting Parallel (Pandas)#
The Python code for the example below can be found online in the DataXlCalcNet repository or in the corresponding local DataXlCalcNet folder in the file D05_PandasPlottingParallel.py, and the XML code in the file D05_PandasPlottingParallel.2D.xml.
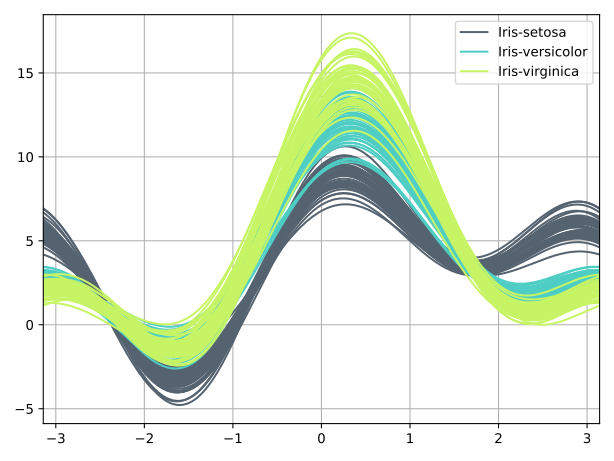
Andrew Curves (Pandas)#
The Python code for the example below can be found online in the DataXlCalcNet repository or in the corresponding local DataXlCalcNet folder in the file D06_PandasAndrewCurves.py, and the XML code in the file D06_PandasAndrewCurves.2D.xml.
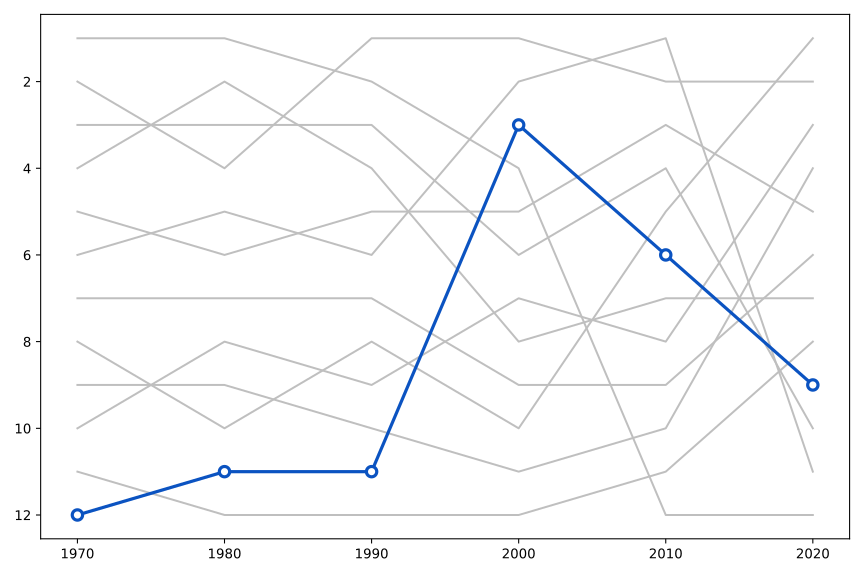
Highlighted LinePlot#
The Python code for the first example below can be found online in the DataXlCalcNet repository or in the corresponding local DataXlCalcNet folder in the file D07a_HighlightedLinePlot1.py, and the XML code in the file D07a_HighlightedLinePlot1.2D.xml.
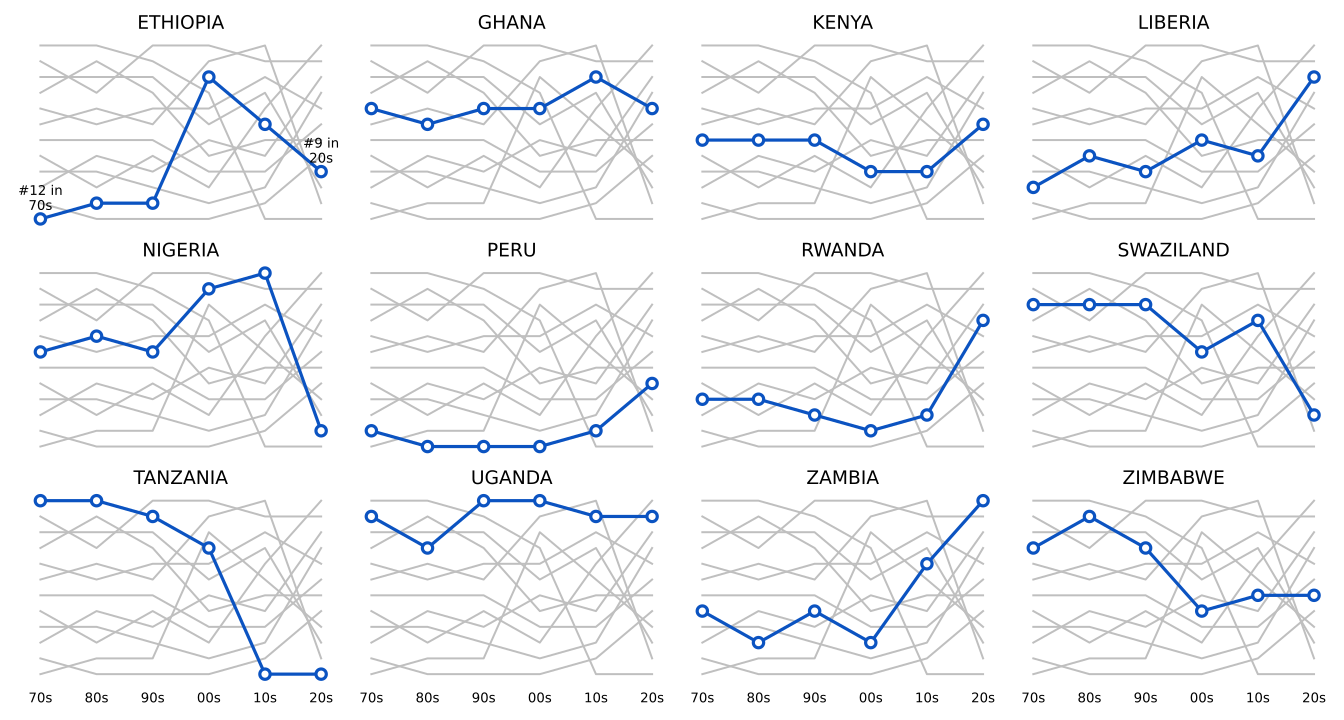
The Python code for the second example below can be found online in the DataXlCalcNet repository or in the corresponding local DataXlCalcNet folder in the file D07b_HighlightedLinePlot2.py, and the XML code in the file D07b_HighlightedLinePlot2.2D.xml.
Some text
Some text
Multiple Lines And Panels#
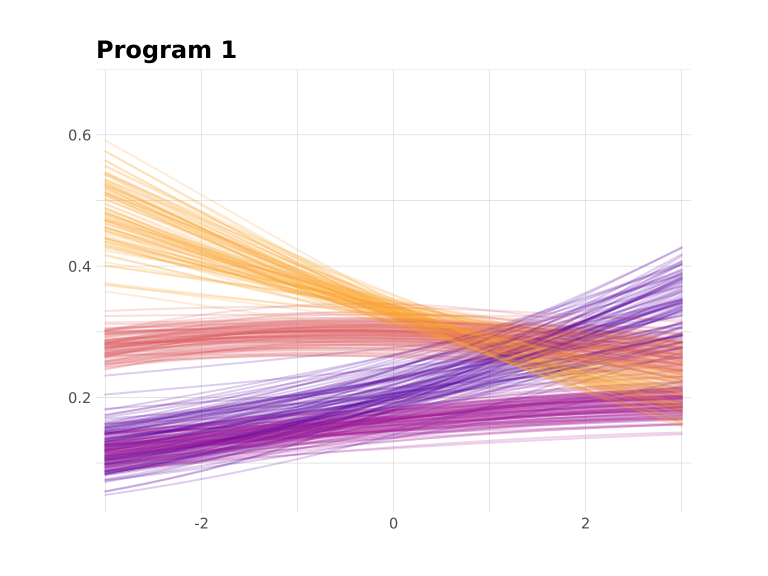
The Python code for the first example below can be found online in the DataXlCalcNet repository or in the corresponding local DataXlCalcNet folder in the file D08a_MultipleLinesAndPanels1.py, and the XML code in the file D08a_MultipleLinesAndPanels1.2D.xml.
The Python code for the second example below can be found online in the DataXlCalcNet repository or in the corresponding local DataXlCalcNet folder in the file D08b_MultipleLinesAndPanels2.py, and the XML code in the file D08b_MultipleLinesAndPanels2.2D.xml.
Some text
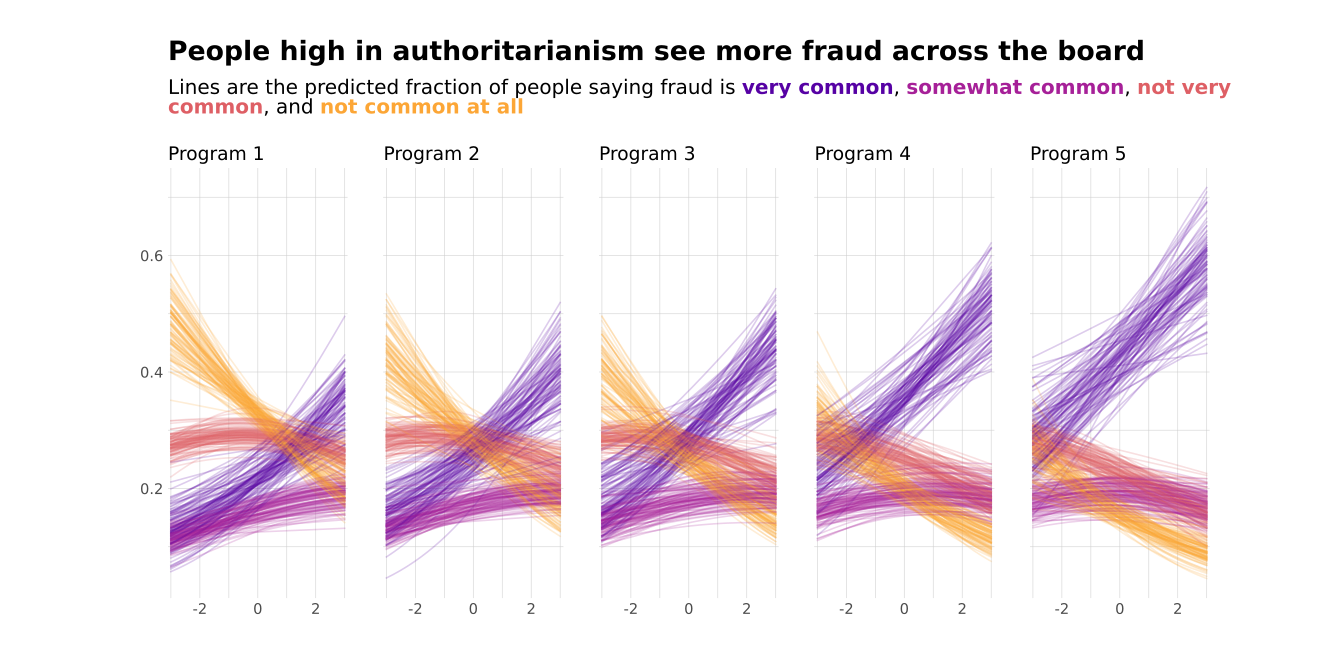
Some text
Line chart with fancy formatting#
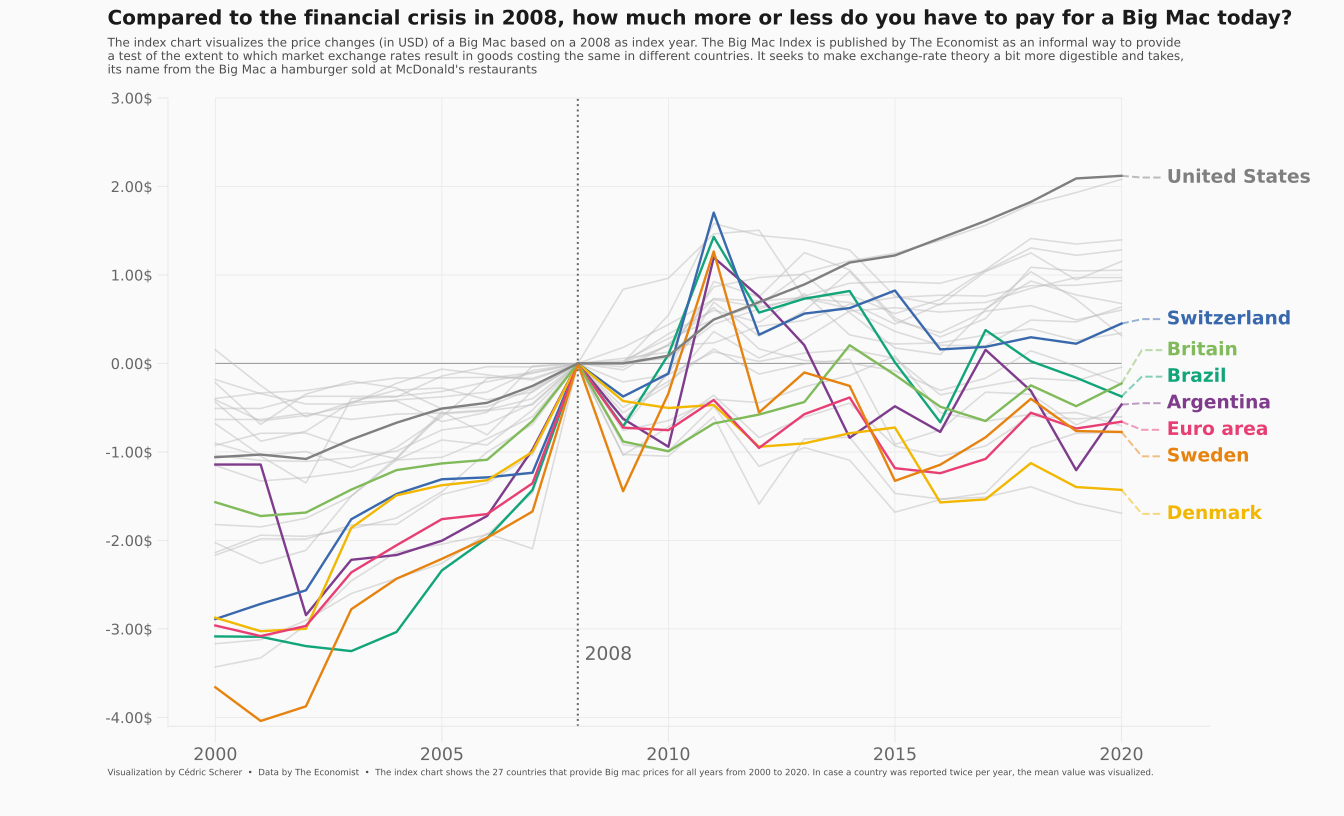
The Python code for the example below can be found online in the DataXlCalcNet repository or in the corresponding local DataXlCalcNet folder in the file D09_LineChartWithFancyFormatting.py, and the XML code in the file D09_LineChartWithFancyFormatting.2D.xml.
Lolllipop 2 Groups#
The Python code for the example below can be found online in the DataXlCalcNet repository or in the corresponding local DataXlCalcNet folder in the file D10_Lolllipop2Groups.py, and the XML code in the file D10_Lolllipop2Groups.2D.xml.
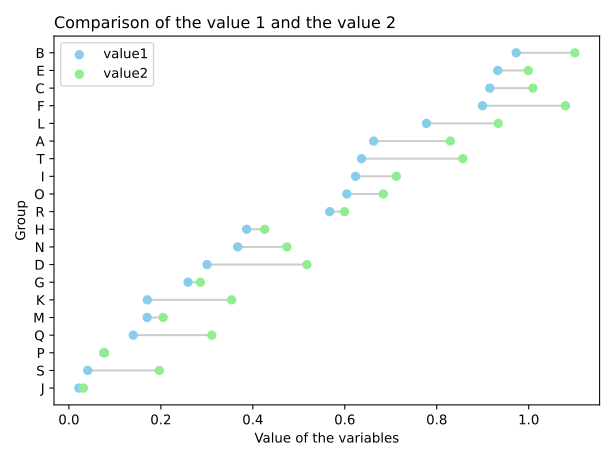
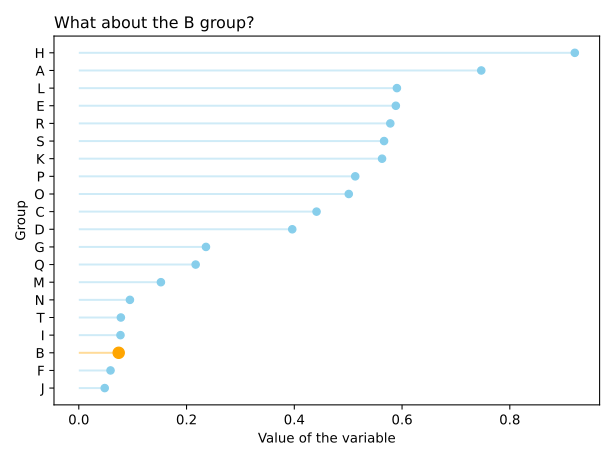
Highlight Group In Lollipop#
The Python code for the example below can be found online in the DataXlCalcNet repository or in the corresponding local DataXlCalcNet folder in the file D11_HighlightGroupInLollipop.py, and the XML code in the file D11_HighlightGroupInLollipop.2D.xml.
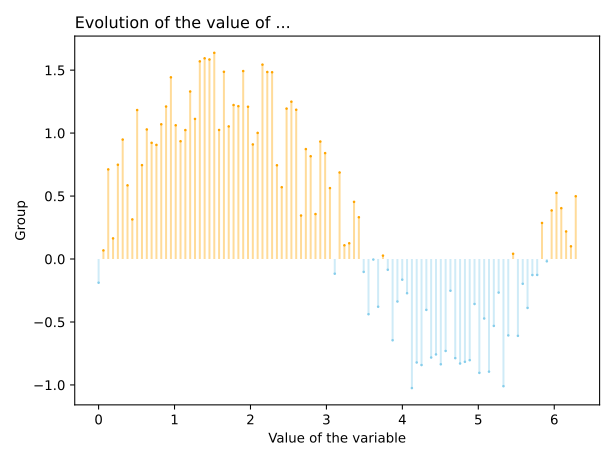
Lolllipop Conditional Color#
The Python code for the example below can be found online in the DataXlCalcNet repository or in the corresponding local DataXlCalcNet folder in the file D12_LolllipopConditionalColor.py, and the XML code in the file D12_LolllipopConditionalColor.2D.xml.
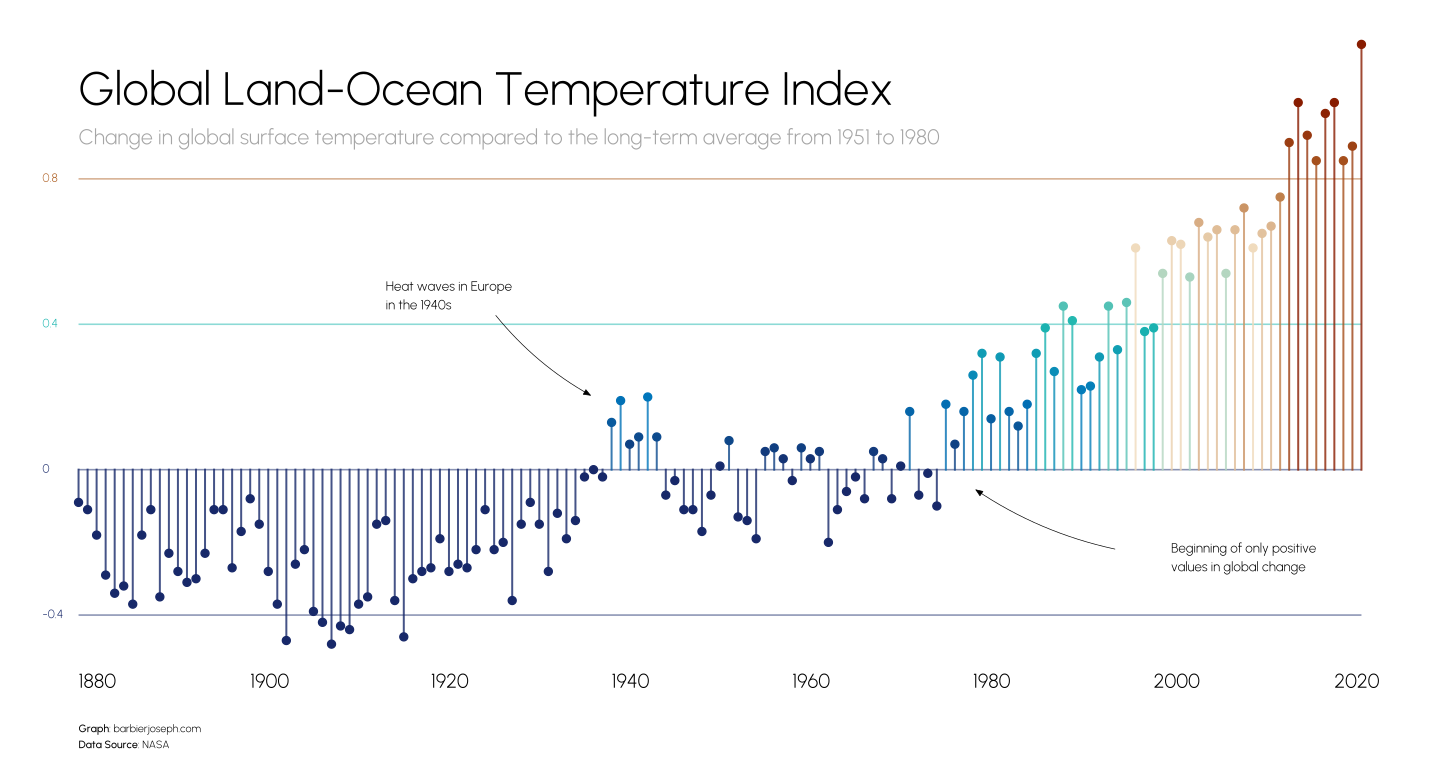
Lollipop chart with fancy formatting#
The Python code for the example below can be found online in the DataXlCalcNet repository or in the corresponding local DataXlCalcNet folder in the file D13_LollipopFancyFormatting.py, and the XML code in the file D13_LollipopFancyFormatting.2D.xml.
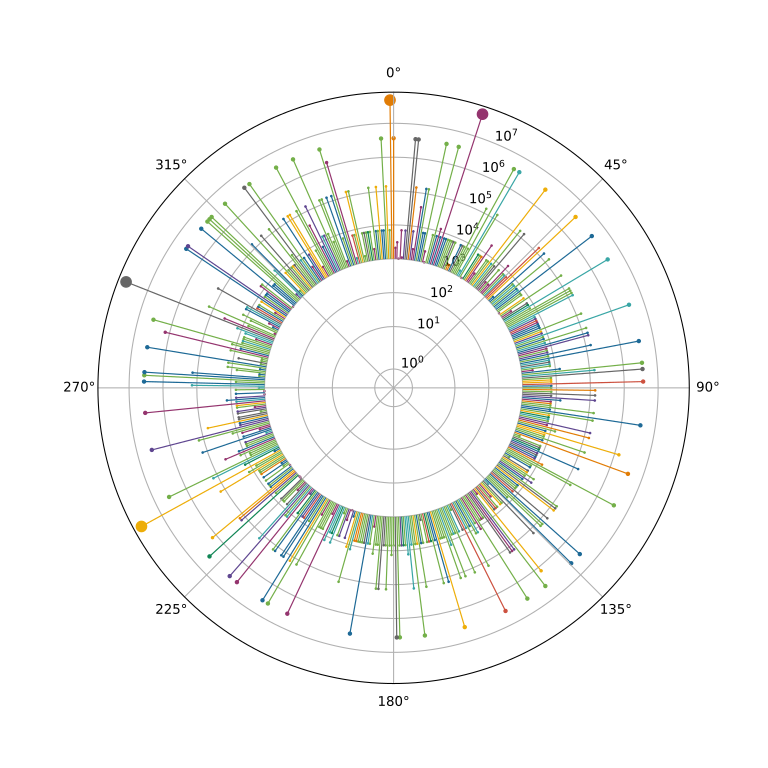
Circular Lolllipop#
The Python code for the first example below can be found online in the DataXlCalcNet repository or in the corresponding local DataXlCalcNet folder in the file D14a_CircularLolllipop1.py, and the XML code in the file D14a_CircularLolllipop1.2D.xml.
The Python code for the second example below can be found online in the DataXlCalcNet repository or in the corresponding local DataXlCalcNet folder in the file D14b_CircularLolllipop2.py, and the XML code in the file D14b_CircularLolllipop2.2D.xml.
The Python code for the third example below can be found online in the DataXlCalcNet repository or in the corresponding local DataXlCalcNet folder in the file D14b_CircularLolllipop3.py, and the XML code in the file D14c_CircularLolllipop3.2D.xml.
Some text
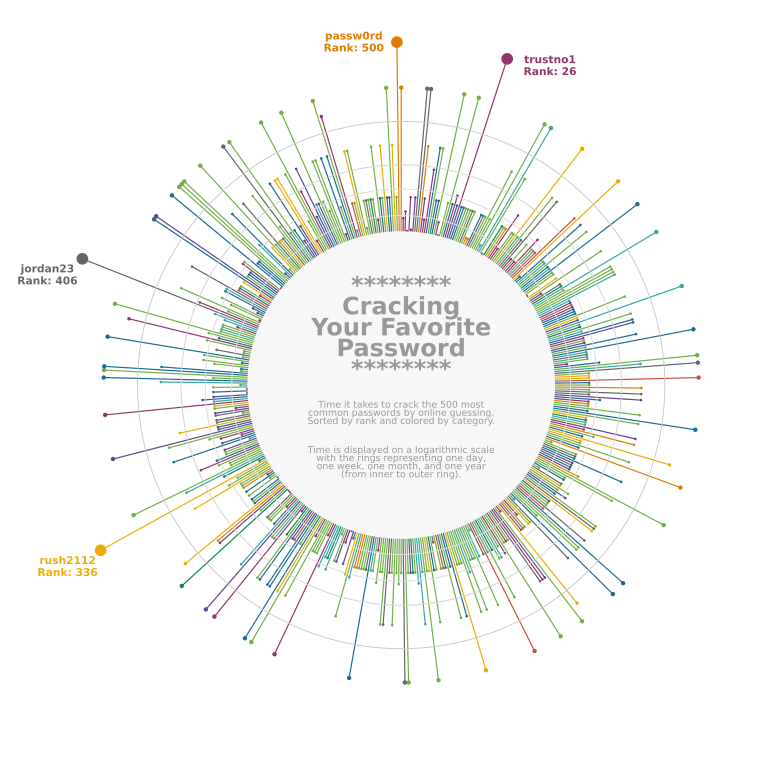
Some text
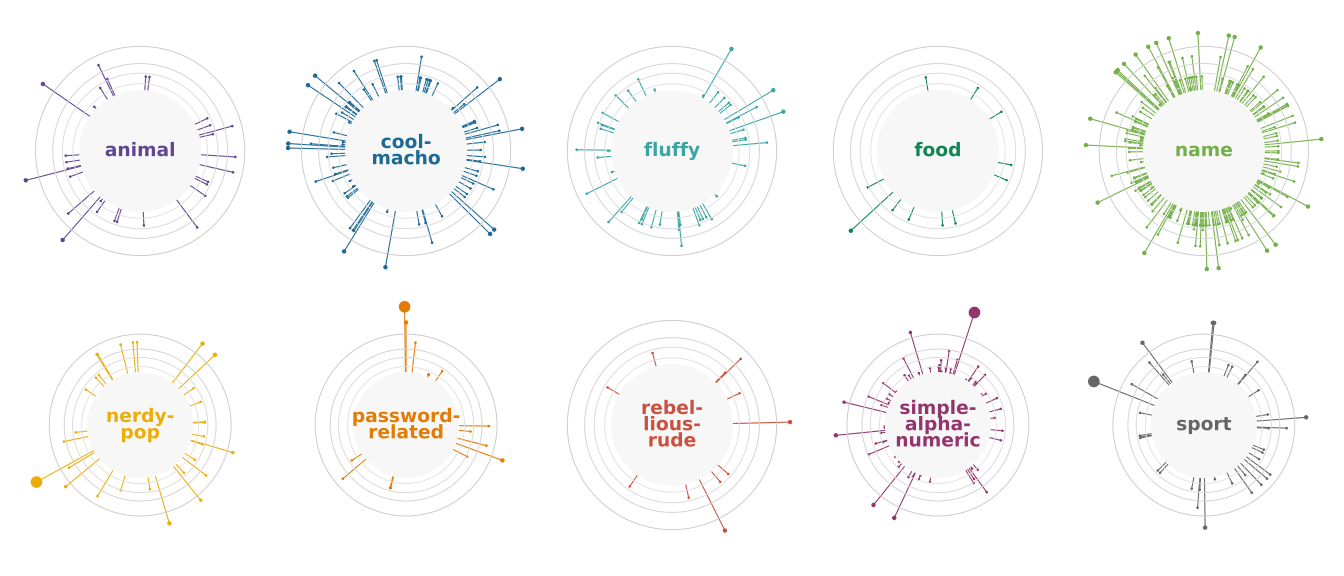
Some text