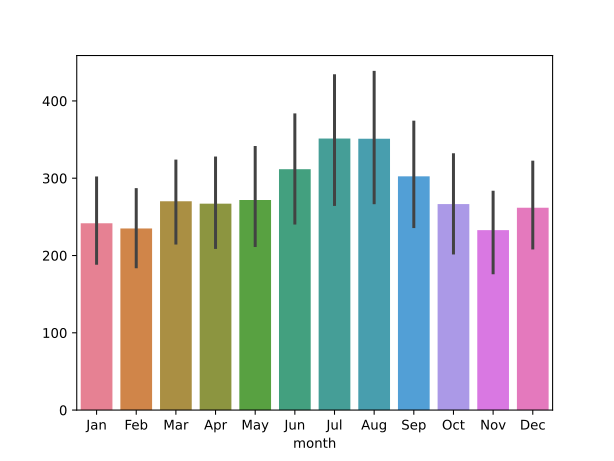
Bar Charts#
Bar chart, part 1#
The Python code for the example below can be found online in the DataXlCalcNet repository or in the corresponding local DataXlCalcNet folder in the file D01_BarChartPart1.py, and the XML code in the file D01_BarChartPart1.2D.xml.
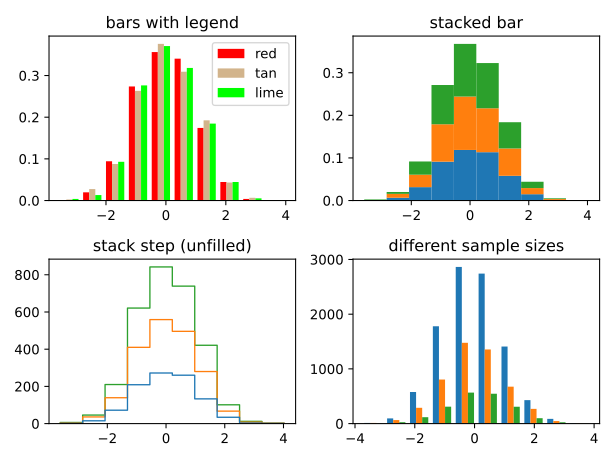
Bar chart, part 1
Bar chart, part 2#
The Python code for the example below can be found online in the DataXlCalcNet repository or in the corresponding local DataXlCalcNet folder in the file D02_BarChartPart2.py, and the XML code in the file D02_BarChartPart2.2D.xml.
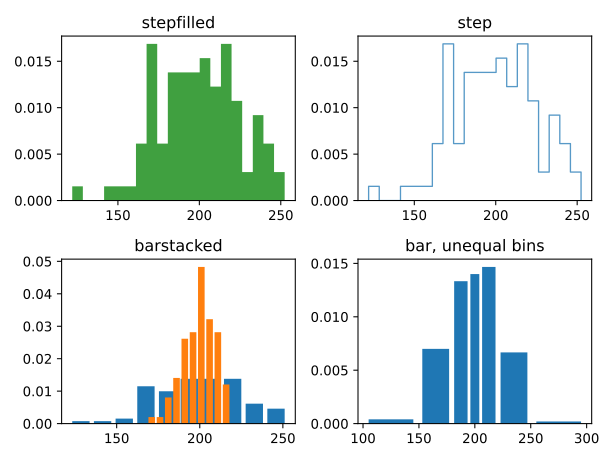
Bar chart, part 2
Stacked Bar Plot#
The Python code for the example below can be found online in the DataXlCalcNet repository or in the corresponding local DataXlCalcNet folder in the file D03_StackedBarPlot.py, and the XML code in the file D03_StackedBarPlot.2D.xml.
Grouped Bar Plot#
The Python code for the example below can be found online in the DataXlCalcNet repository or in the corresponding local DataXlCalcNet folder in the file D04_GroupedBarPlot.py, and the XML code in the file D04_GroupedBarPlot.2D.xml.
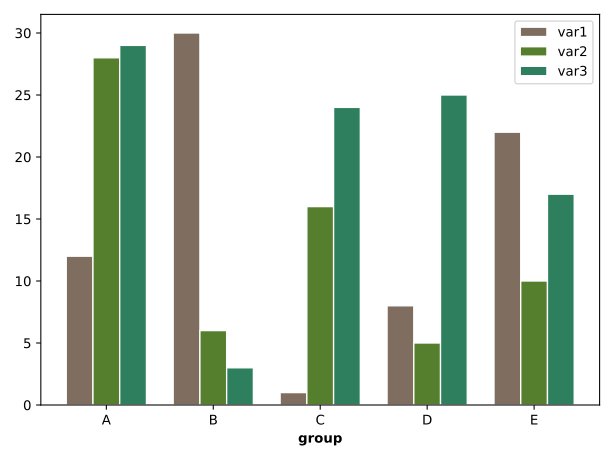
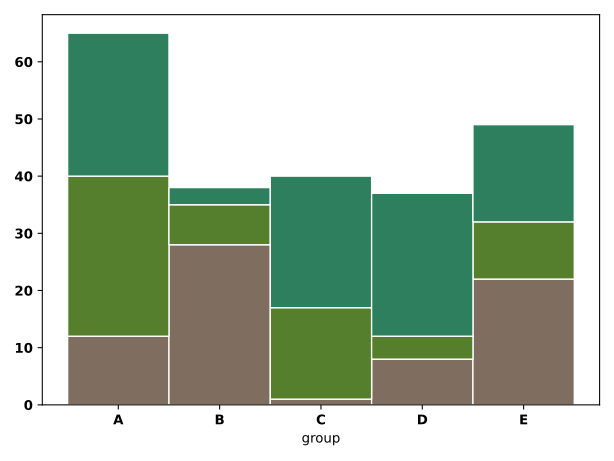
Grouped StackedBar Plot#
The Python code for the example below can be found online in the DataXlCalcNet repository or in the corresponding local DataXlCalcNet folder in the file D05_GroupedStackedBarPlot.py, and the XML code in the file D05_GroupedStackedBarPlot.2D.xml.
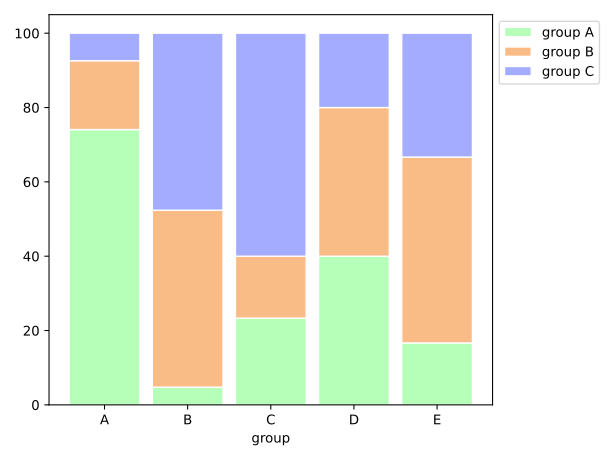
Barplot with error bar#
The Python code for the example below can be found online in the DataXlCalcNet repository or in the corresponding local DataXlCalcNet folder in the file D06_BarPlotWithErrorBar.py, and the XML code in the file D06_BarPlotWithErrorBar.2D.xml.
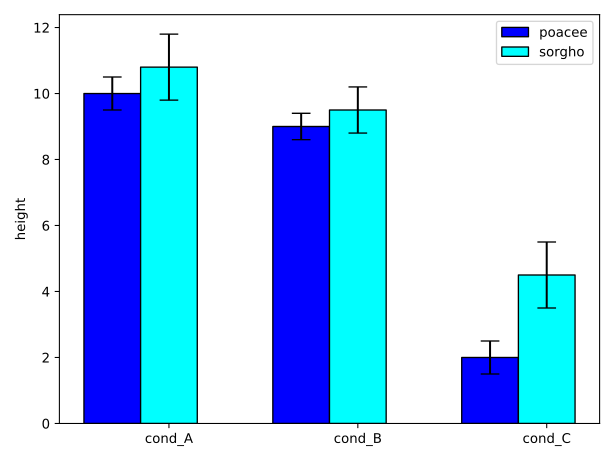
Waterfall Plot#
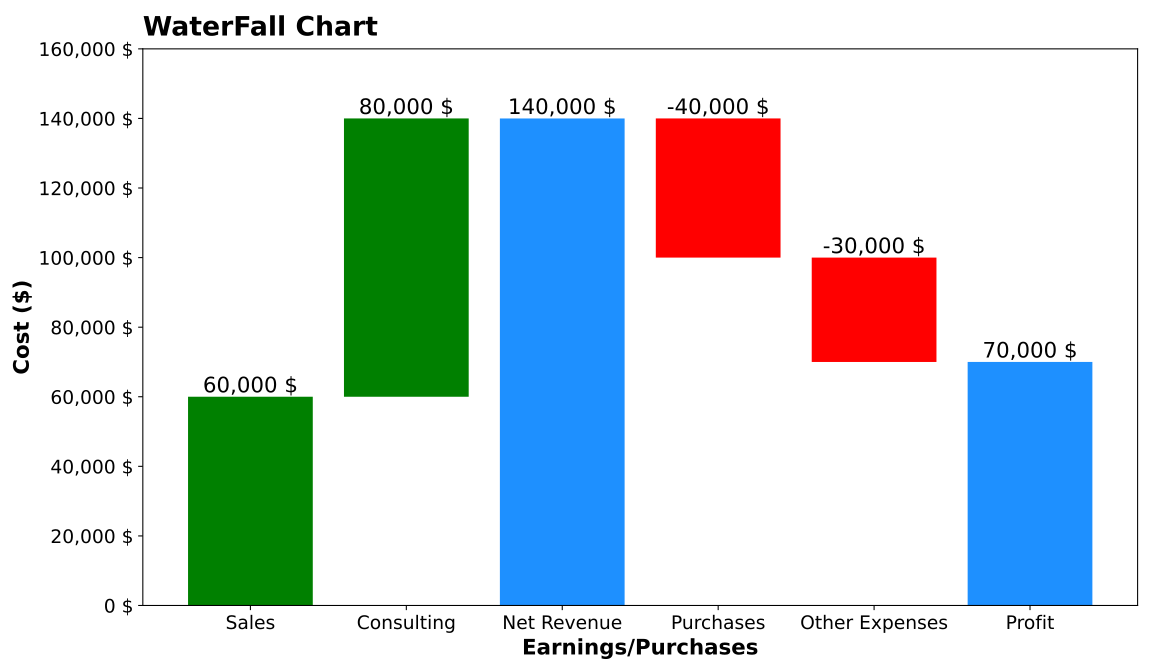
The Python code for the first example below can be found online in the DataXlCalcNet repository or in the corresponding local DataXlCalcNet folder in the file D07a_WaterfallChart1.py, and the XML code in the file D07a_WaterfallChart1.2D.xml.
The Python code for the second example below can be found online in the DataXlCalcNet repository or in the corresponding local DataXlCalcNet folder in the file D07b_WaterfallChart2.py, and the XML code in the file D07b_WaterfallChart2.2D.xml.
 \(\quad\)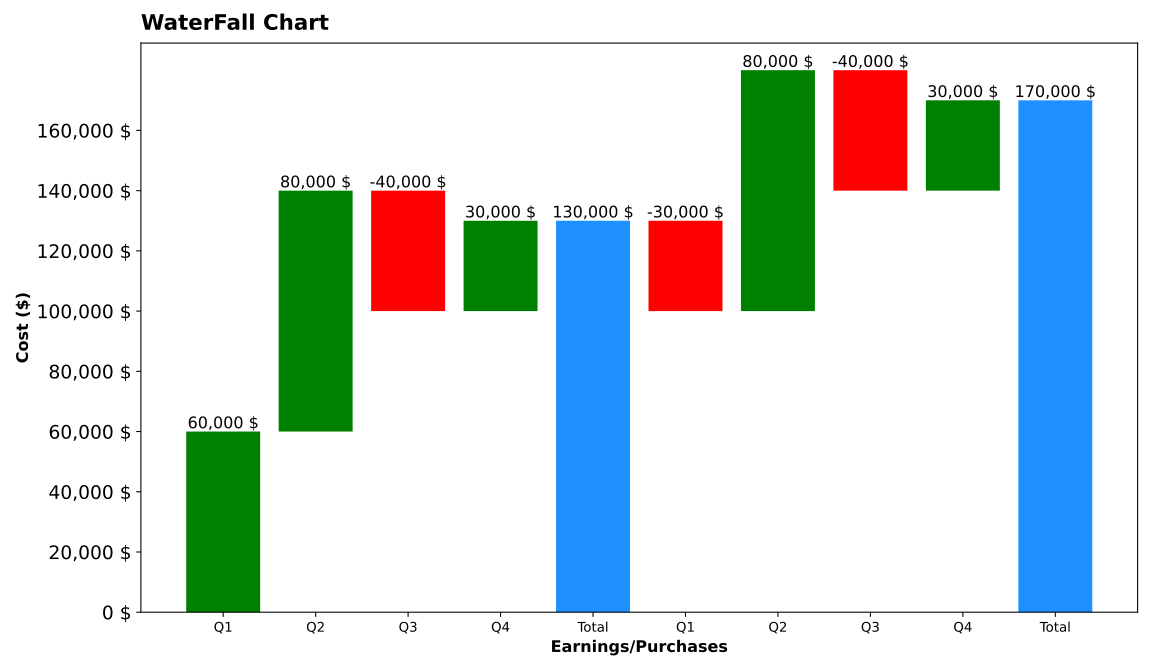
Mirror Histogram#
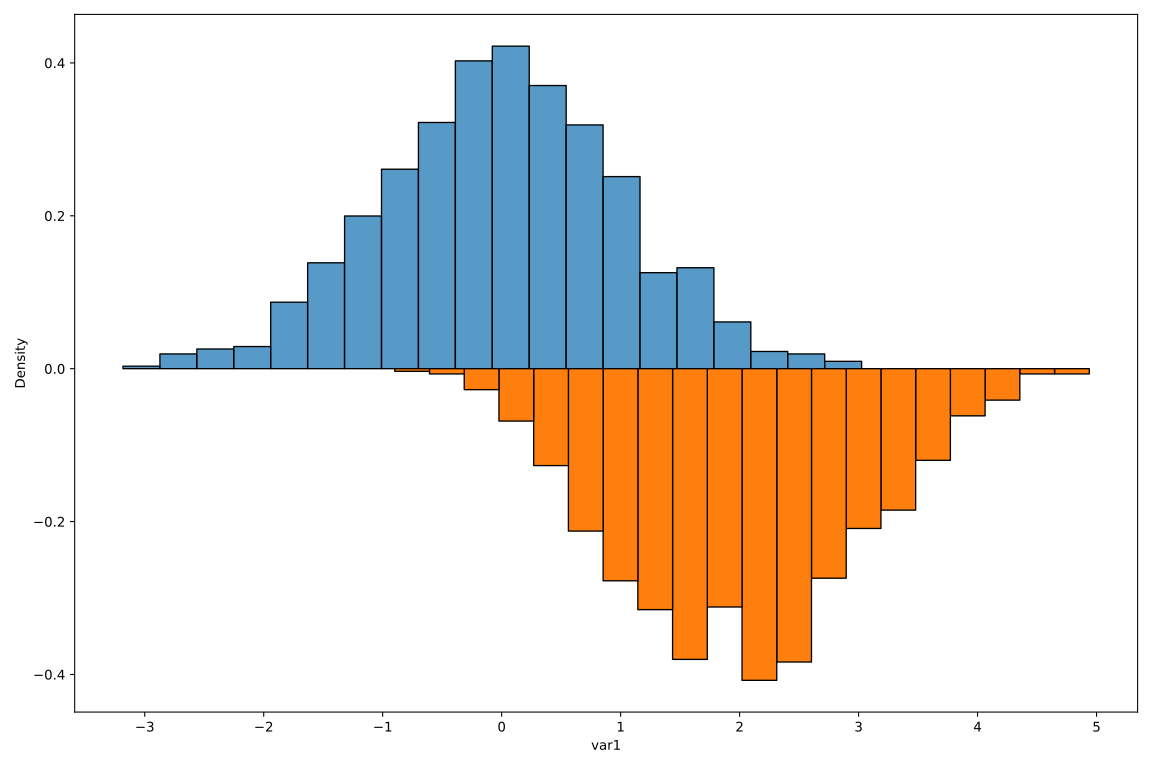
The Python code for the example below can be found online in the DataXlCalcNet repository or in the corresponding local DataXlCalcNet folder in the file D08_MirrorHistogram.py, and the XML code in the file D08_MirrorHistogram.2D.xml.
Horizontal Bar#
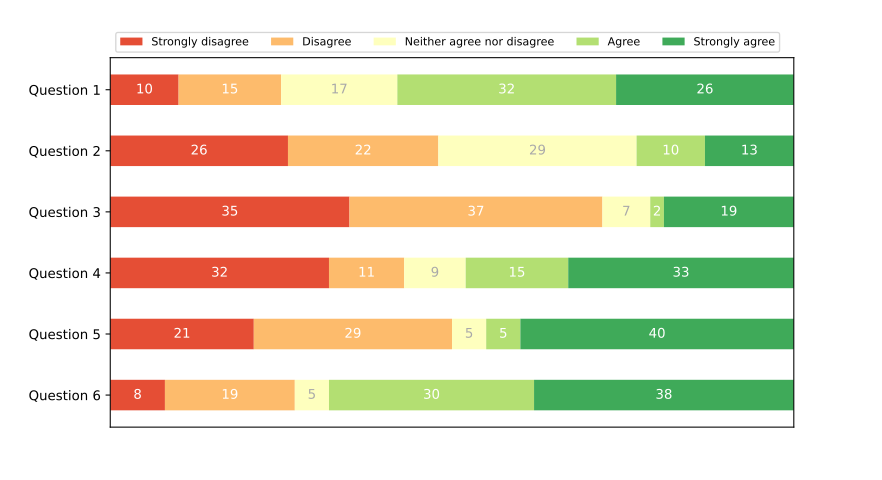
The Python code for the example below can be found online in the DataXlCalcNet repository or in the corresponding local DataXlCalcNet folder in the file D09_HorizontalBarDist.py, and the XML code in the file D09_HorizontalBarDist.2D.xml.
Horizontal Error Bar#
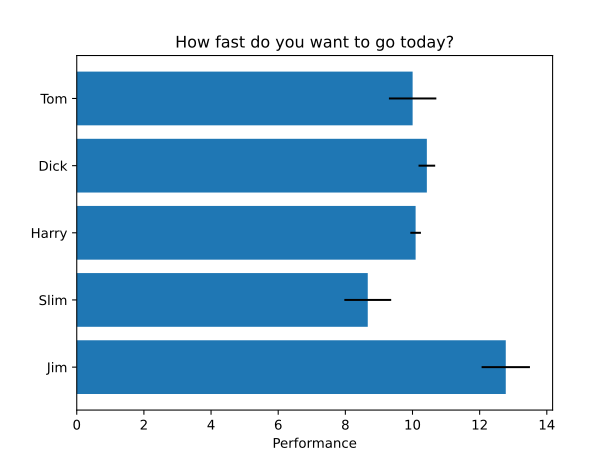
The Python code for the example below can be found online in the DataXlCalcNet repository or in the corresponding local DataXlCalcNet folder in the file D10_HorizontalErrorBar.py, and the XML code in the file D10_HorizontalErrorBar.2D.xml.
Stacked horizontal bar with labels#
The Python code for the example below can be found online in the DataXlCalcNet repository or in the corresponding local DataXlCalcNet folder in the file D11_StackedHBarWithLabels.py, and the XML code in the file D11_StackedHBarWithLabels.2D.xml.
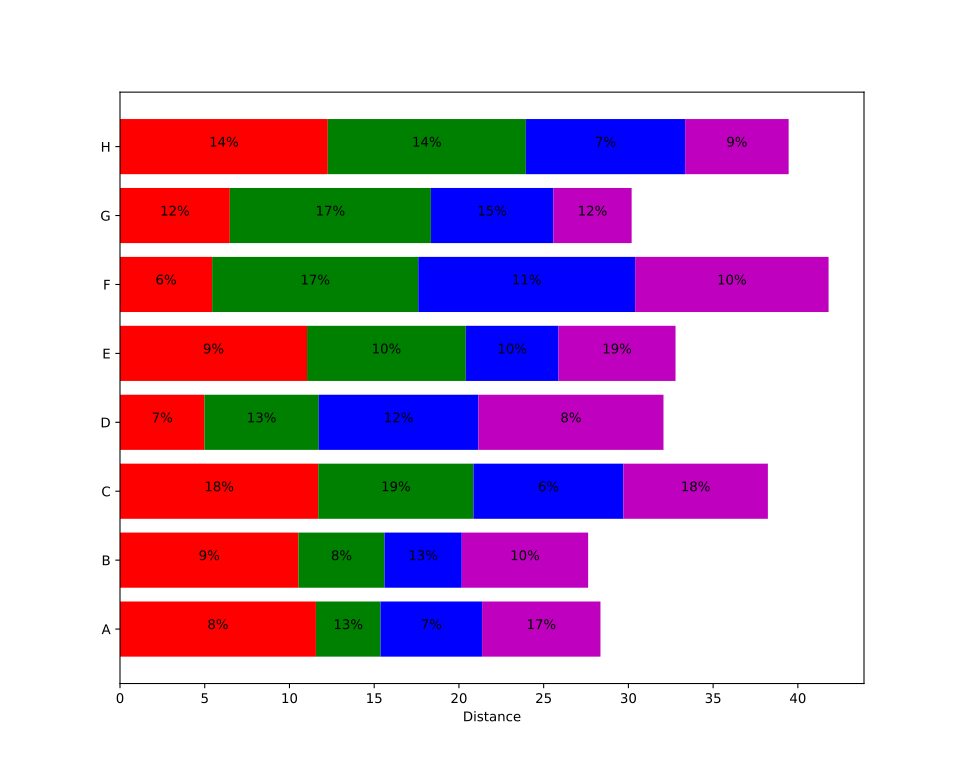
Stacked and grouped horizontal bar#
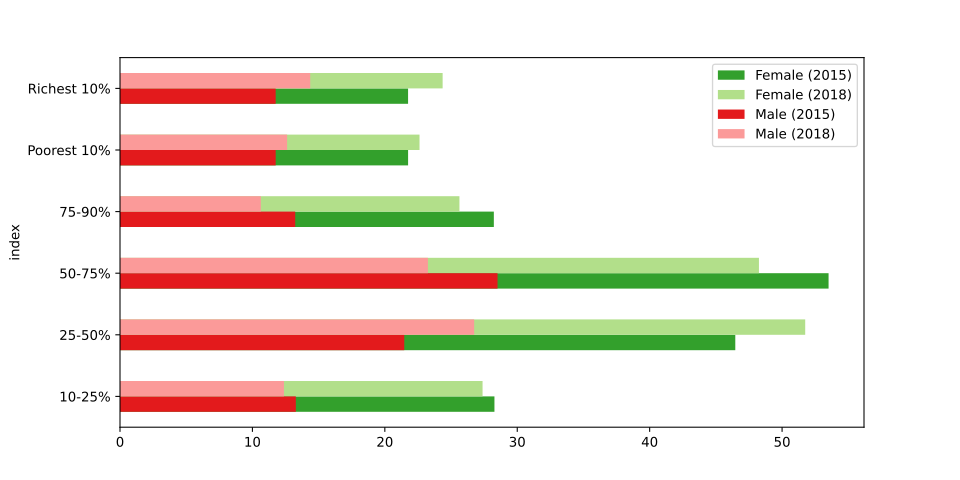
The Python code for the example below can be found online in the DataXlCalcNet repository or in the corresponding local DataXlCalcNet folder in the file D12_StackedAndGroupedHBar.py, and the XML code in the file D12_StackedAndGroupedHBar.2D.xml.
Gantt Chart#
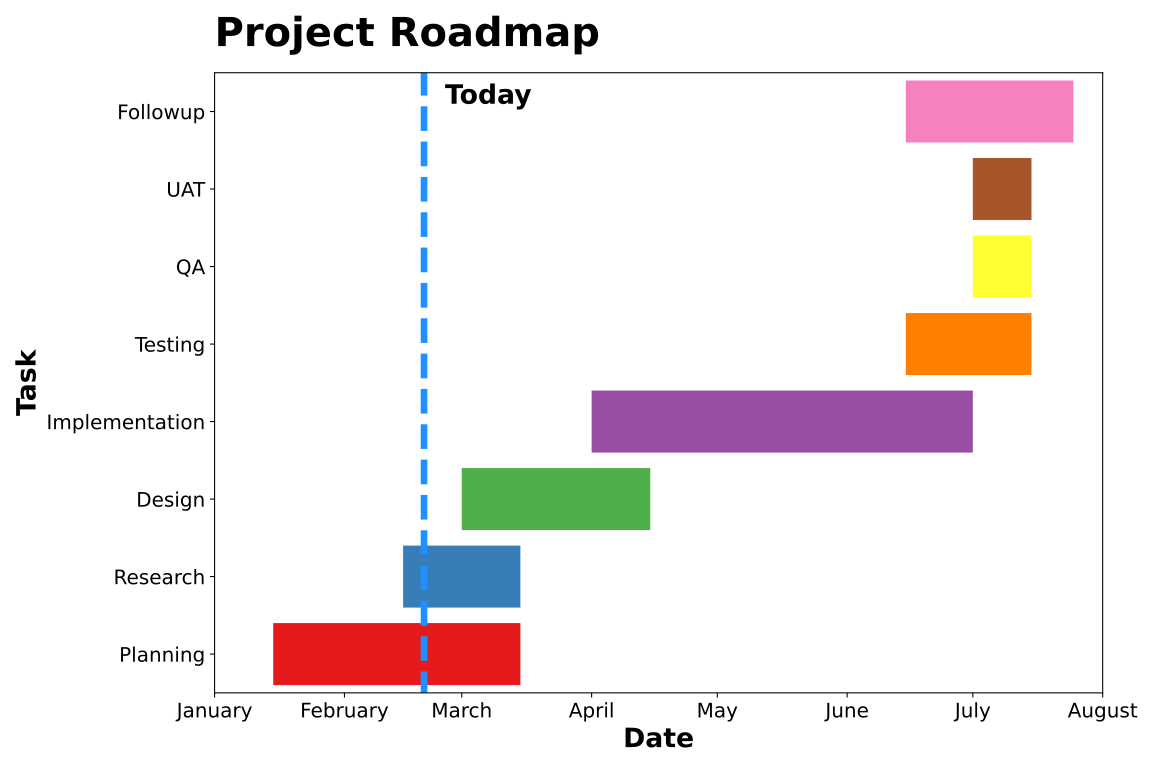
The Python code for the first example below can be found online in the DataXlCalcNet repository or in the corresponding local DataXlCalcNet folder in the file D13a_GanttChart1.py, and the XML code in the file D13a_GanttChart1.2D.xml.
The Python code for the second example below can be found online in the DataXlCalcNet repository or in the corresponding local DataXlCalcNet folder in the file D13b_GanttChart2.py, and the XML code in the file D13b_GanttChart2.2D.xml.
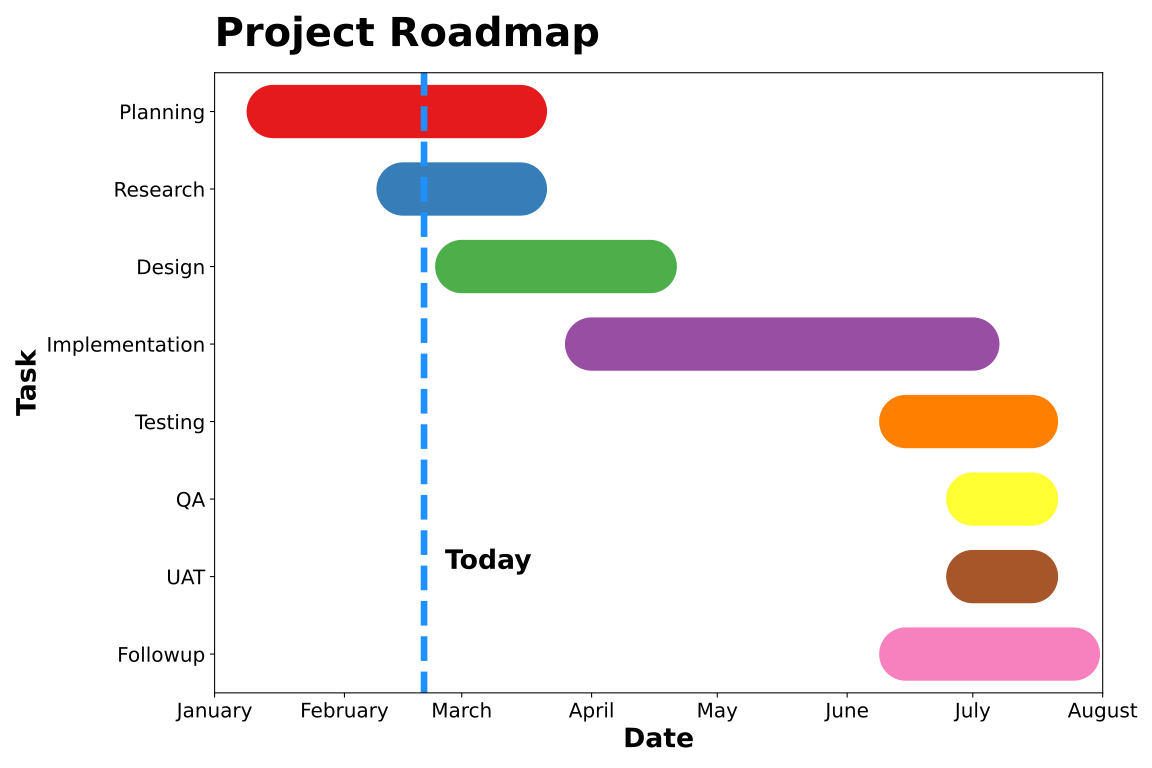
The Python code for the third example below can be found online in the DataXlCalcNet repository or in the corresponding local DataXlCalcNet folder in the file D13c_GanttChart3.py, and the XML code in the file D13c_GanttChart3.2D.xml.
 \(\quad\)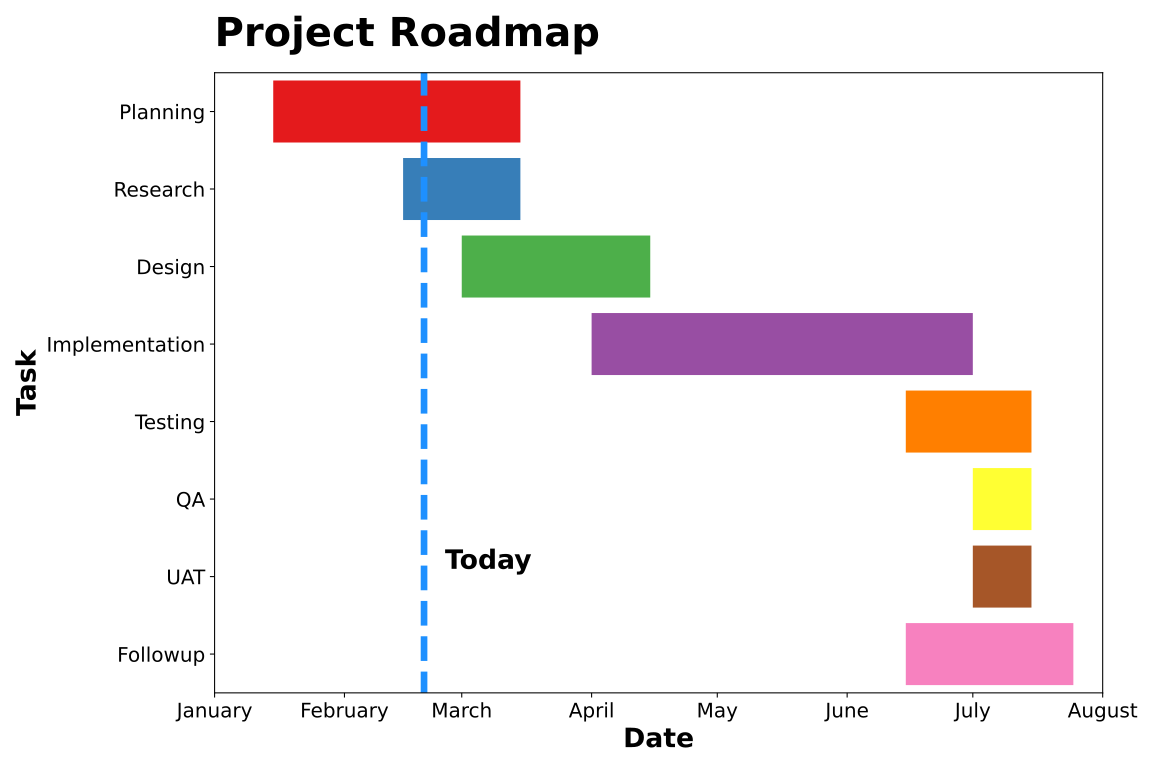
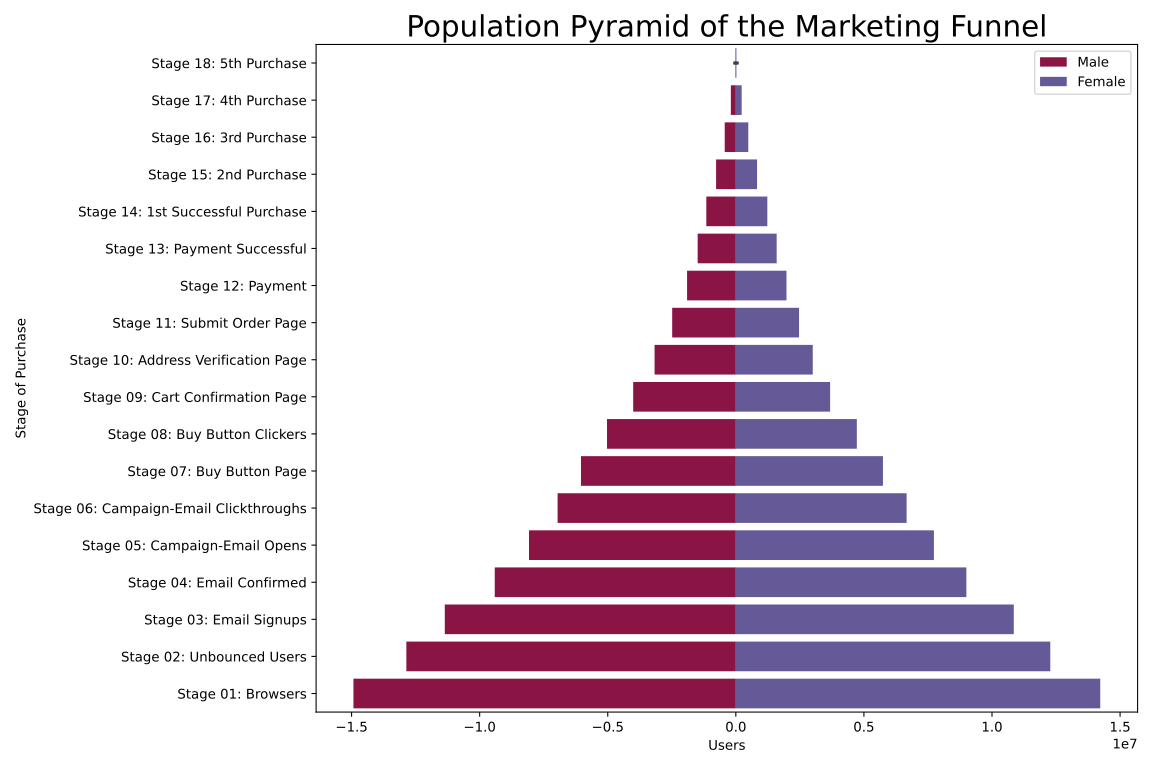
Marketing Funnel#
The Python code for the example below can be found online in the DataXlCalcNet repository or in the corresponding local DataXlCalcNet folder in the file D14_MarketingFunnel.py, and the XML code in the file D14_MarketingFunnel.2D.xml.
Some text
Population Pyramid#
The Python code for the example below can be found online in the DataXlCalcNet repository or in the corresponding local DataXlCalcNet folder in the file D15_PopulationPyramid.py, and the XML code in the file D15_PopulationPyramid.2D.xml.
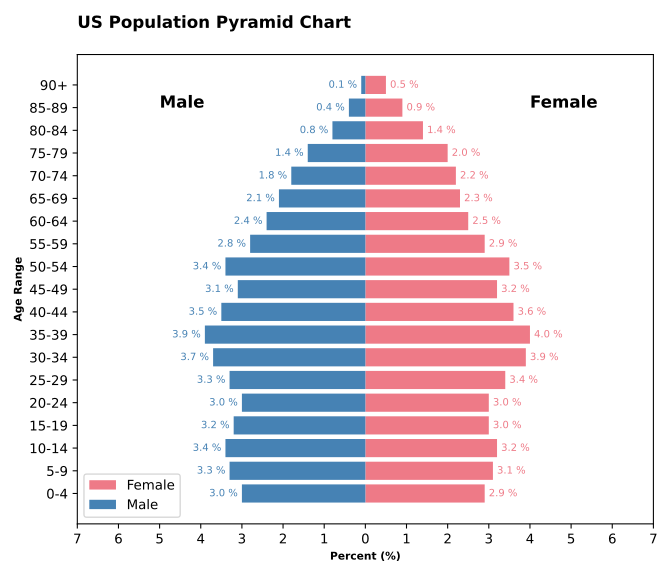
Mirror Bar Plot (horizontal)#
The Python code for the example below can be found online in the DataXlCalcNet repository or in the corresponding local DataXlCalcNet folder in the file D16_MirrorBarPlot.py, and the XML code in the file D16_MirrorBarPlot.2D.xml.
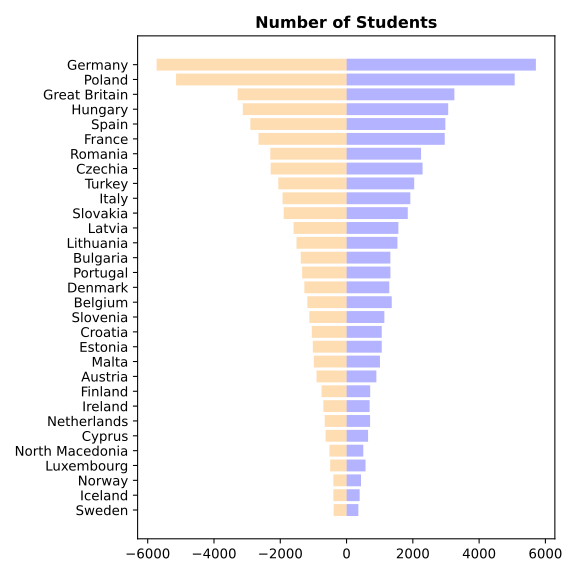
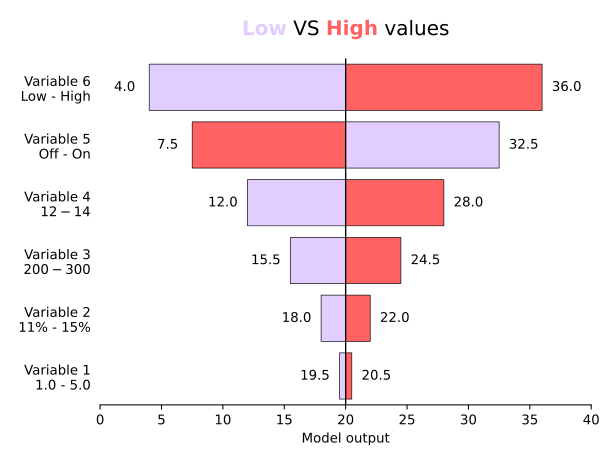
Tornado Chart#
The Python code for the example below can be found online in the DataXlCalcNet repository or in the corresponding local DataXlCalcNet folder in the file D17_TornadoChart.py, and the XML code in the file D17_TornadoChart.2D.xml.
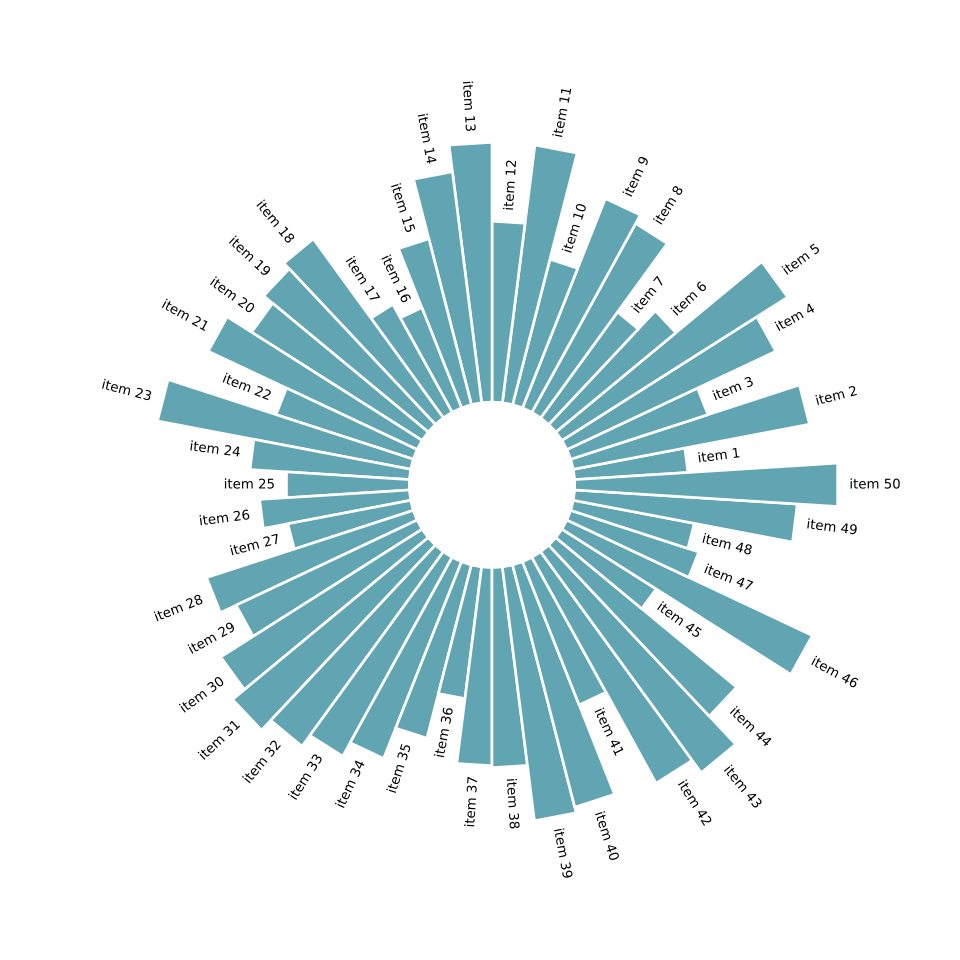
Circular Barplot#
The Python code for the example below can be found online in the DataXlCalcNet repository or in the corresponding local DataXlCalcNet folder in the file D18_CircularBarplot.py, and the XML code in the file D18_CircularBarplot.2D.xml.
Barplot with color#
The Python code for the example below can be found online in the DataXlCalcNet repository or in the corresponding local DataXlCalcNet folder in the file D19_BarplotColor.py, and the XML code in the file D19_BarplotColor.2D.xml.