Weierstrass elliptic functions, in terms of elliptic period ratio \(\tau\)#
Weierstrass function \(\wp(z| \tau)\)#
Some Text
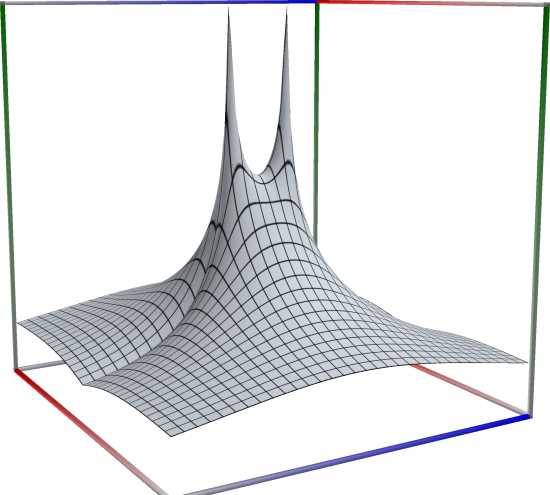 \(\quad\)
 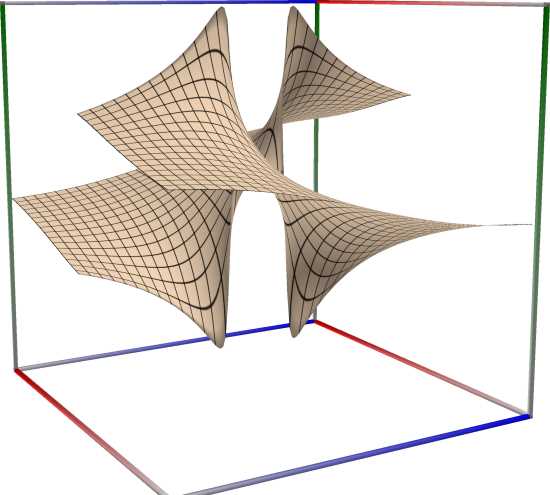 \(\quad\)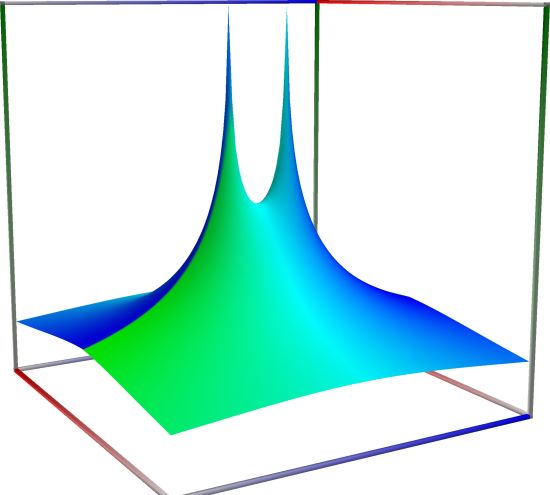
3D wpf plot: real part (left figure), imaginary part (middle figure) and absolute value with color-coded phase (right figure) of the complex sine function \(z = \sin(x + iy)\), with \(-6 \le x \le 6\) (blue axis), \(-6 \le y \le 6\) (red axis), \(-10 \le z \le 10\) (green axis). Function values are loglog-transformed.
Weierstrass function, first derivative: \(\wp'z| \tau)\)#
Some Text
\(\quad\) \(\quad\)
3D wpf plot: real part (left figure), imaginary part (middle figure) and absolute value with color-coded phase (right figure) of the complex sine function \(z = \sin(x + iy)\), with \(-6 \le x \le 6\) (blue axis), \(-6 \le y \le 6\) (red axis), \(-10 \le z \le 10\) (green axis). Function values are loglog-transformed.
Inverse Weierstrass function \(\wp^{-1}(z| \tau)\)#
Some Text
\(\quad\) \(\quad\)
3D wpf plot: real part (left figure), imaginary part (middle figure) and absolute value with color-coded phase (right figure) of the complex sine function \(z = \sin(x + iy)\), with \(-6 \le x \le 6\) (blue axis), \(-6 \le y \le 6\) (red axis), \(-10 \le z \le 10\) (green axis). Function values are loglog-transformed.
Weierstrass Zeta function \(\zeta(z, \tau)\)#
Some Text
\(\quad\) \(\quad\)
3D wpf plot: real part (left figure), imaginary part (middle figure) and absolute value with color-coded phase (right figure) of the complex sine function \(z = \sin(x + iy)\), with \(-6 \le x \le 6\) (blue axis), \(-6 \le y \le 6\) (red axis), \(-10 \le z \le 10\) (green axis). Function values are loglog-transformed.
Weierstrass Sigma function \(\sigma(z| \tau)\)#
Some Text
\(\quad\) \(\quad\)
3D wpf plot: real part (left figure), imaginary part (middle figure) and absolute value with color-coded phase (right figure) of the complex sine function \(z = \sin(x + iy)\), with \(-6 \le x \le 6\) (blue axis), \(-6 \le y \le 6\) (red axis), \(-10 \le z \le 10\) (green axis). Function values are loglog-transformed.