Special techniques for height surfaces, real and complex functions#
Wpf figures as standard display of complex functions#
This is a description of the standard display of complex functions, using the square function as an example:
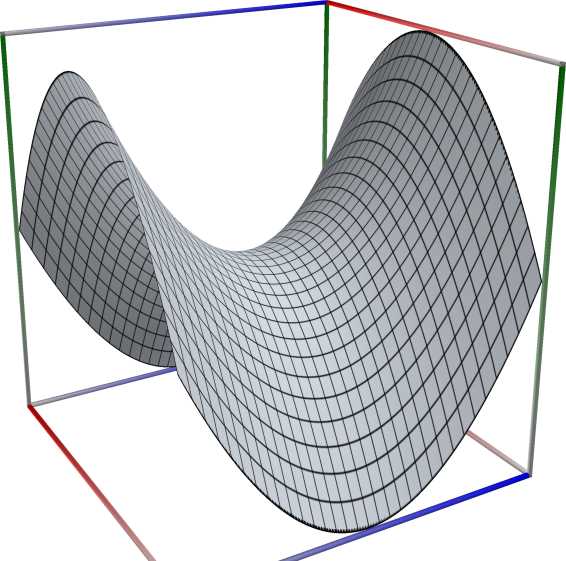
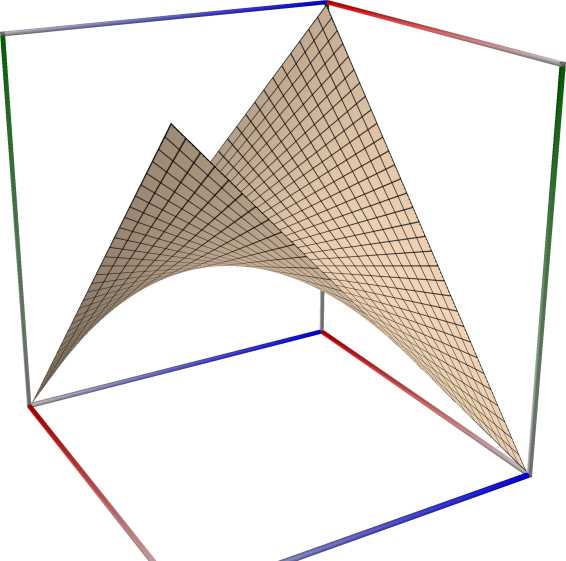
The figures below are showing the real part (left figure), imaginary part (middle figure) and absolute value with color-coded phase (right figure) of the complex function \(z = \mathrm{sqr}(x + iy)\) with \(-2 \le x \le 2\) (blue axis), \(-2 \le y \le 2\) (red axis), \(-10 \le z \le 10\) (green axis).
 \(\quad\)
  \(\quad\)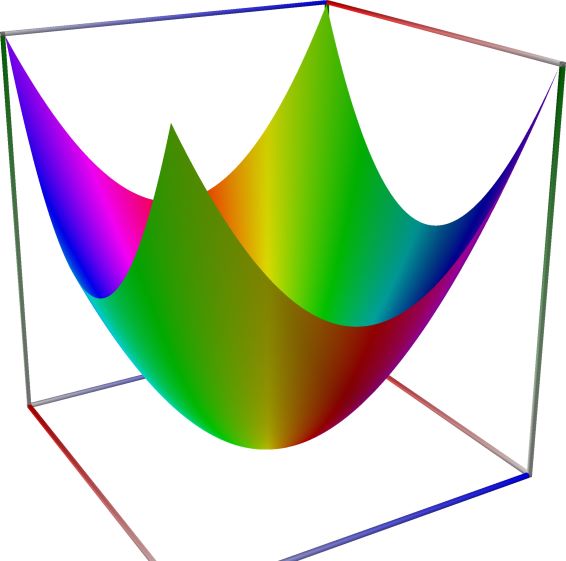
Note
Although the range of the green axis is stated in the form \(z_{\text{min}} \le z \le z_{\text{max}}\), with \(z_{\text{min}} \ne 0\) in general, this applies only for the figures showing the real and imaginary part. For the figure showing the absolute value we have always \(z_{\text{min}} = 0\). This note is omitted from the standard text describing complex functions in this manual for better readability.
Truncation vs loglog transformation#
\(\quad\)
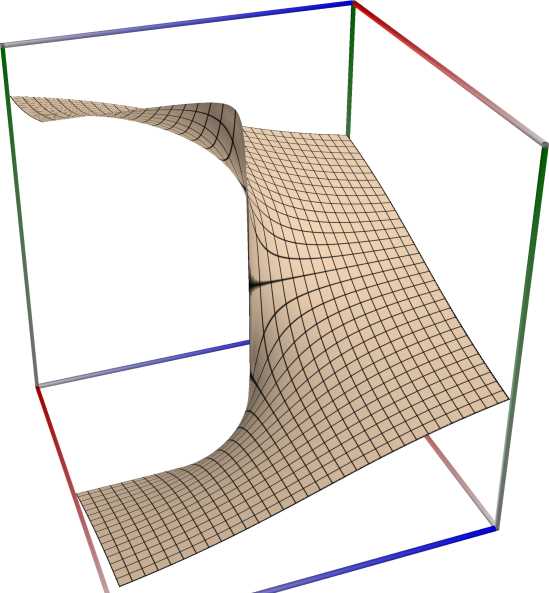
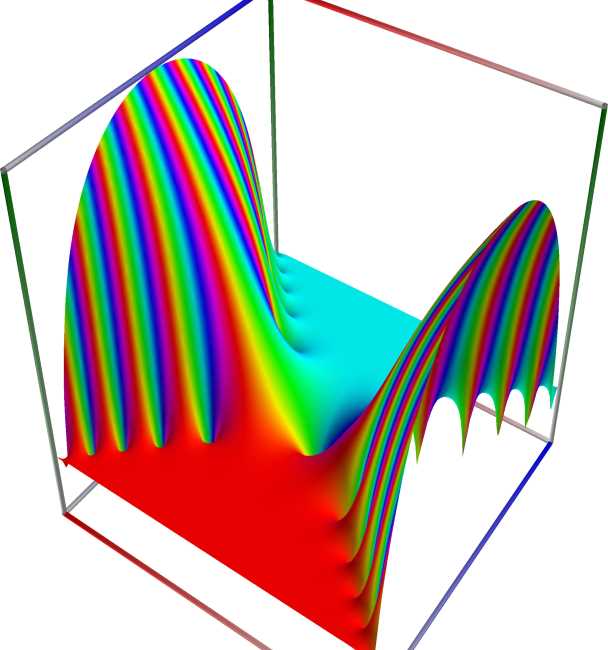
3D wpf plot: Surface plot without cutting of the branch cut (left figure), Surface plot with cutting of the branch cut (right figure)
Displaying branch cuts#
\(\quad\)
3D wpf plot: Surface plot without cutting of the branch cut (left figure). Surface plot with cutting of the branch cut (right figure).