Domain coloring#
See also: https://www.dynamicmath.xyz/domain-coloring/
See also: https://iquilezles.org/articles/palettes/
See also: jcponce/complex
See also: Wegert [796].
See also: Matplotlib and MayaVi implementation of domain coloring by E. Petrisor, https://nbviewer.org/github/empet/Math/blob/master/DomainColoring.ipynb
See also: https://en.wikipedia.org/wiki/Domain_coloring
See also: https://notebook.community/empet/Math/DomainColoring
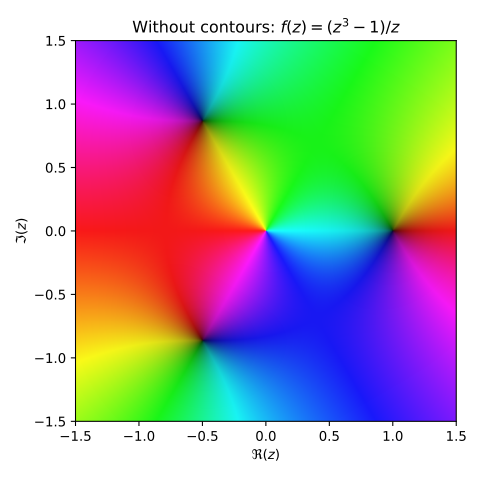
Domain coloring without contours: \(f(z) = (z^3-1)/z\)#
The Python code for the example below can be found online in the DataXlCalcNet repository or in the corresponding local DataXlCalcNet folder in the file D01_DomainColoring.py, and the XML code in the file D01_DomainColoringRF1.2D.xml.
To produce the figure as shown below, the try-block at the end of the file should look like this:
try:
    if __name__ == '__main__':
        DomainColoring(func=lambda z:(z**3-1)/z, style='c', re=[-1.5, 1.5],
            im=[-1.5, 1.5], Title=r'$f(z)=\dfrac{z^3-1}{z}$', daxis=True)
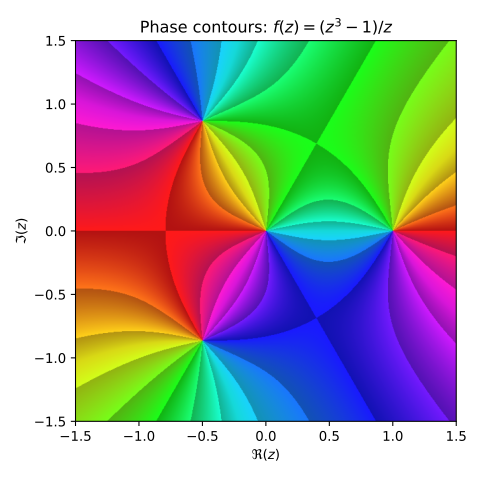
Domain coloring with contours of the phase: \(f(z) = (z^3-1)/z\)#
The Python code for the example below can be found online in the DataXlCalcNet repository or in the corresponding local DataXlCalcNet folder in the file D01_DomainColoring.py, and the XML code in the file D01_DomainColoringRF1.2D.xml.
To produce the figure as shown below, the try-block at the end of the file should look like this:
try:
    if __name__ == '__main__':
        DomainColoring(func=lambda z:(z**3-1)/z, style='p', re=[-1.5, 1.5],
            im=[-1.5, 1.5], Title=r'$f(z)=\dfrac{z^3-1}{z}$', daxis=True)
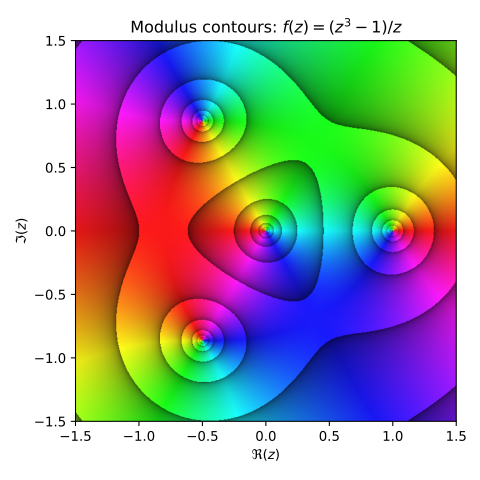
Domain coloring with contours of the modulus: \(f(z) = (z^3-1)/z\)#
The Python code for the example below can be found online in the DataXlCalcNet repository or in the corresponding local DataXlCalcNet folder in the file D01_DomainColoring.py, and the XML code in the file D01_DomainColoringRF1.2D.xml.
To produce the figure as shown below, the try-block at the end of the file should look like this:
try:
    if __name__ == '__main__':
        DomainColoring(func=lambda z:(z**3-1)/z, style='m', re=[-1.5, 1.5],
            im=[-1.5, 1.5], Title=r'$f(z)=\dfrac{z^3-1}{z}$', daxis=True)
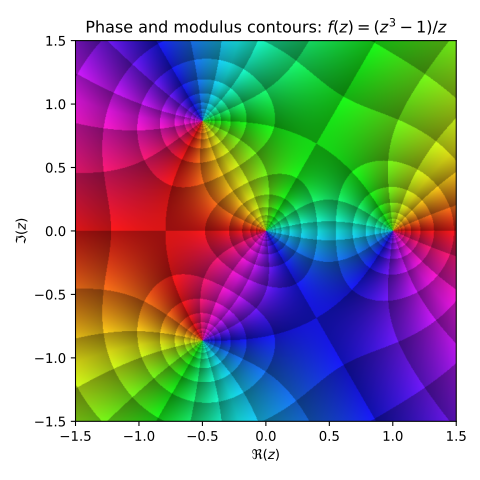
Domain coloring with contours of phase and modulus: \(f(z) = (z^3-1)/z\)#
The Python code for the example below can be found online in the DataXlCalcNet repository or in the corresponding local DataXlCalcNet folder in the file D01_DomainColoring.py, and the XML code in the file D01_DomainColoringRF1.2D.xml.
To produce the figure as shown below, the try-block at the end of the file should look like this:
try:
    if __name__ == '__main__':
        DomainColoring(func=lambda z:(z**3-1)/z, style='pm', re=[-1.5, 1.5],
            im=[-1.5, 1.5], Title=r'$f(z)=\dfrac{z^3-1}{z}$', daxis=True)
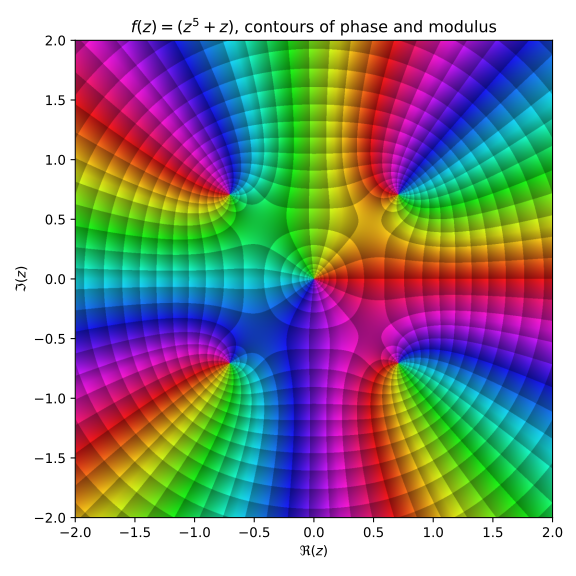
Domain coloring with contours of phase and modulus: \(f(z) = z^5 + z\)#
The Python code for the example below can be found online in the DataXlCalcNet repository or in the corresponding local DataXlCalcNet folder in the file D01_DomainColoring.py, and the XML code in the file D01_DomainColoringRF1.2D.xml.
To produce the figure as shown below, the try-block at the end of the file should look like this:
try:
    if __name__ == '__main__':
        DomainColoring(func=lambda z:z**5 + z, style='pm', re=[-2, 2],
            im=[-2, 2], Title=r'$f(z)=(z^5+z)$', daxis=True)
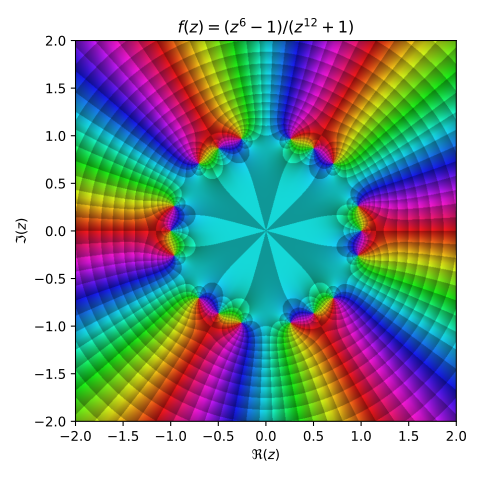
Domain coloring with contours of phase and modulus: \(f(z) = (z^6-1)/(z^{12}+1)\)#
The Python code for the example below can be found online in the DataXlCalcNet repository or in the corresponding local DataXlCalcNet folder in the file D01_DomainColoring.py, and the XML code in the file D01_DomainColoringRF1.2D.xml.
To produce the figure as shown below, the try-block at the end of the file should look like this:
try:
    if __name__ == '__main__':
        DomainColoring(func=lambda z:(z**6-1) / (z**12+1), style='pm', re=[-2.0, 2.0],
            im=[-2.0, 2.0], Title=r'$f(z)=\dfrac{z^6-1}{z^{12}+1}$', daxis=True)
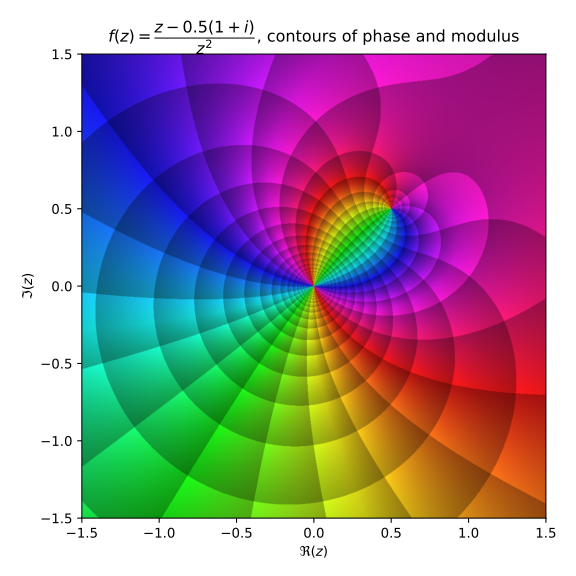
Domain coloring with contours of phase and modulus: \(f(z) = (z-0.5(1+i))/z^2\)#
The Python code for the example below can be found online in the DataXlCalcNet repository or in the corresponding local DataXlCalcNet folder in the file D01_DomainColoring.py, and the XML code in the file D01_DomainColoringRF1.2D.xml.
To produce the figure as shown below, the try-block at the end of the file should look like this:
try:
    if __name__ == '__main__':
        DomainColoring(func=lambda z:(z - 0.5 - 0.5*1j) / z**2, style='pm', re=[-1.5, 1.5],
            im=[-1.5, 1.5], Title=r'$f(z)=\dfrac{z-0.5(1+i)}{z^2}$', daxis=True)
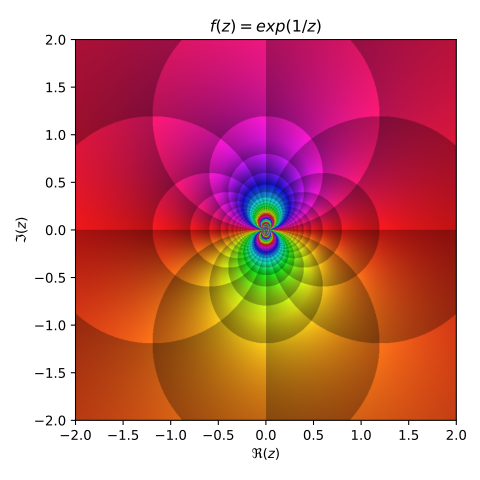
Domain coloring with contours of phase and modulus: \(f(z) = \exp(1/z)\)#
The Python code for the example below can be found online in the DataXlCalcNet repository or in the corresponding local DataXlCalcNet folder in the file D01_DomainColoring.py, and the XML code in the file D01_DomainColoringRF1.2D.xml.
To produce the figure as shown below, the try-block at the end of the file should look like this:
try:
    if __name__ == '__main__':
        DomainColoring(func=lambda z:np.exp(1/z), style='pm', re=[-2.0, 2.0],
            im=[-2.0, 2.0], Title=r'$f(z)=\exp(1/z)$', daxis=True)
Domain coloring with contours of phase and modulus: \(f(z) = z \exp(1/z)\)#
The Python code for the example below can be found online in the DataXlCalcNet repository or in the corresponding local DataXlCalcNet folder in the file D01_DomainColoring.py, and the XML code in the file D01_DomainColoringRF1.2D.xml.
To produce the figure as shown below, the try-block at the end of the file should look like this:
try:
    if __name__ == '__main__':
        DomainColoring(func=lambda z:np.exp(1/z), style='pm', re=[-2.0, 2.0],
            im=[-2.0, 2.0], Title=r'$f(z)=\exp(1/z)$', daxis=True)
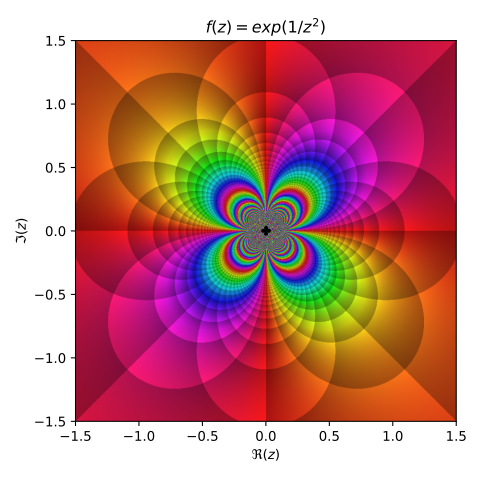
Domain coloring with contours of phase and modulus: \(f(z) = \exp(1/z^2)\)#
The Python code for the example below can be found online in the DataXlCalcNet repository or in the corresponding local DataXlCalcNet folder in the file D01_DomainColoring.py, and the XML code in the file D01_DomainColoringRF1.2D.xml.
To produce the figure as shown below, the try-block at the end of the file should look like this:
try:
    if __name__ == '__main__':
        DomainColoring(func=lambda z:np.exp(1.0 / z**2), style='pm', re=[-1.5, 1.5],
            im=[-1.5, 1.5], Title=r'$f(z)=\exp(1/z^2)$', daxis=True)
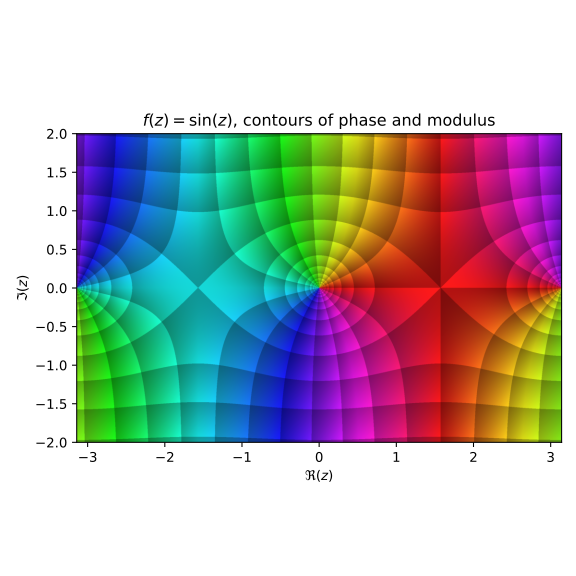
Domain coloring with contours of phase and modulus: \(f(z) = \sin(z)\)#
The Python code for the example below can be found online in the DataXlCalcNet repository or in the corresponding local DataXlCalcNet folder in the file D01_DomainColoring.py, and the XML code in the file D01_DomainColoringRF1.2D.xml.
To produce the figure as shown below, the try-block at the end of the file should look like this:
try:
    if __name__ == '__main__':
        DomainColoring(func=lambda z:np.sin(z), style='pm', re=[-np.pi, np.pi],
            im=[-2, 2], Title=r'$f(z)=\sin(z)$', daxis=True)
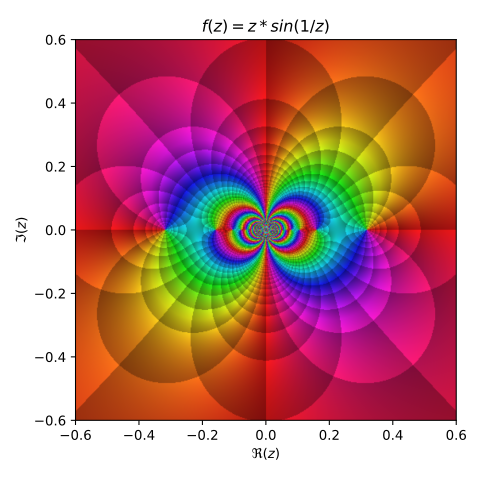
Domain coloring with contours of phase and modulus: \(f(z) = z \sin(1/z)\)#
The Python code for the example below can be found online in the DataXlCalcNet repository or in the corresponding local DataXlCalcNet folder in the file D01_DomainColoring.py, and the XML code in the file D01_DomainColoringRF1.2D.xml.
To produce the figure as shown below, the try-block at the end of the file should look like this:
try:
    if __name__ == '__main__':
        DomainColoring(func=lambda z:z*np.sin(1/z), style='pm', re=[-0.6, 0.6],
            im=[-0.6, 0.6], Title=r'$f(z)=z \cdot \sin(1/z)$', daxis=True)
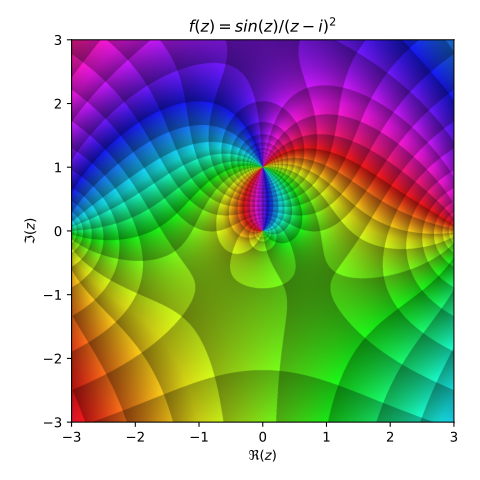
Domain coloring with contours of phase and modulus: \(f(z) = \sin(z) / (z-i)^2\)#
The Python code for the example below can be found online in the DataXlCalcNet repository or in the corresponding local DataXlCalcNet folder in the file D01_DomainColoring.py, and the XML code in the file D01_DomainColoringRF1.2D.xml.
To produce the figure as shown below, the try-block at the end of the file should look like this:
try:
    if __name__ == '__main__':
        DomainColoring(func=lambda z:np.sin(z) / (z-1j)**2, style='pm', re=[-3, 3],
            im=[-3, 3], Title=r'$f(z)=\dfrac{\sin(z)}{(z-i)^2}$', daxis=True)
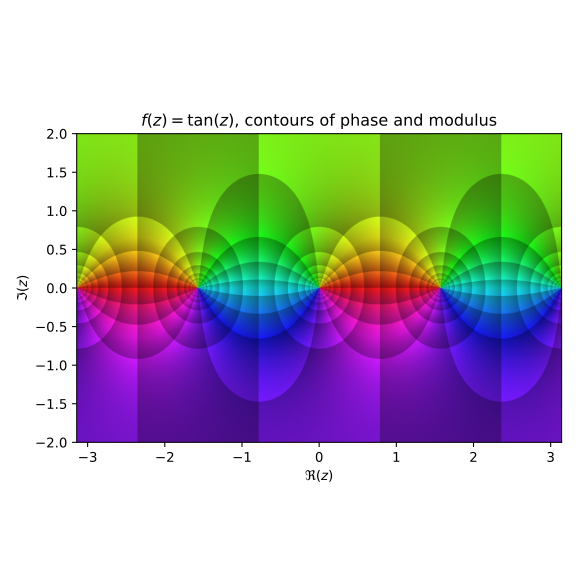
Domain coloring with contours of phase and modulus: \(f(z) = \tan(z)\)#
The Python code for the example below can be found online in the DataXlCalcNet repository or in the corresponding local DataXlCalcNet folder in the file D01_DomainColoring.py, and the XML code in the file D01_DomainColoringRF1.2D.xml.
To produce the figure as shown below, the try-block at the end of the file should look like this:
try:
    if __name__ == '__main__':
        DomainColoring(func=lambda z:np.tan(z), style='pm', re=[-np.pi, np.pi],
            im=[-2, 2], Title=r'$f(z)=\tan(z)$', daxis=True)