Correlation and regression#
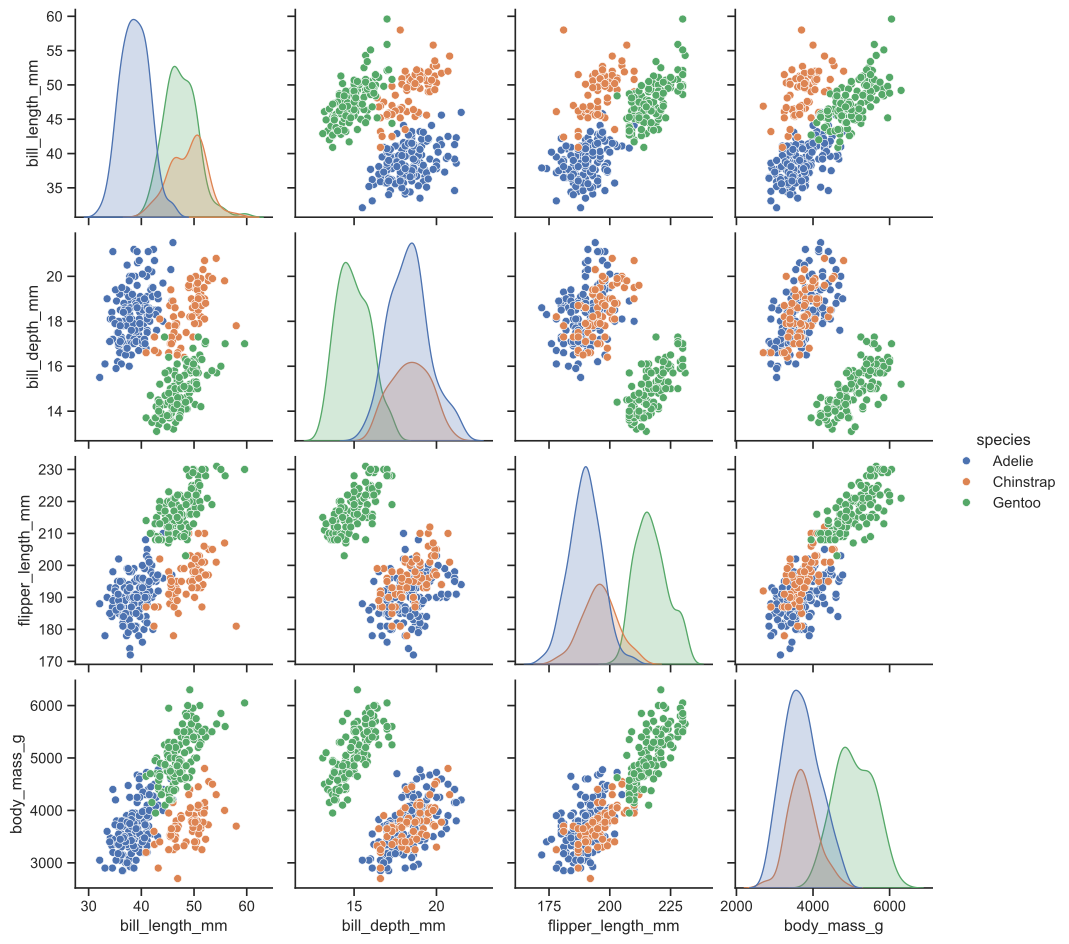
Linear regression with confidence Band#
The Python code for the example below can be found online in the DataXlCalcNet repository or in the corresponding local DataXlCalcNet folder in the file D01_LinRegWithConfidenceBand.py, and the XML code in the file D01_LinRegWithConfidenceBand.2D.xml.
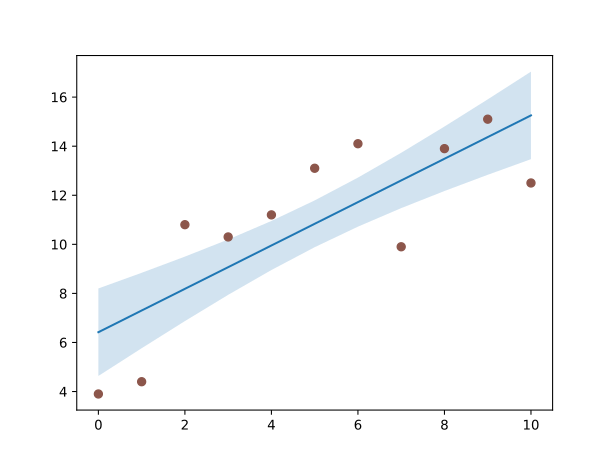
Anscombe example#
The Python code for the example below can be found online in the DataXlCalcNet repository or in the corresponding local DataXlCalcNet folder in the file D02_AnscombeExample.py, and the XML code in the file D02_AnscombeExample.2D.xml.
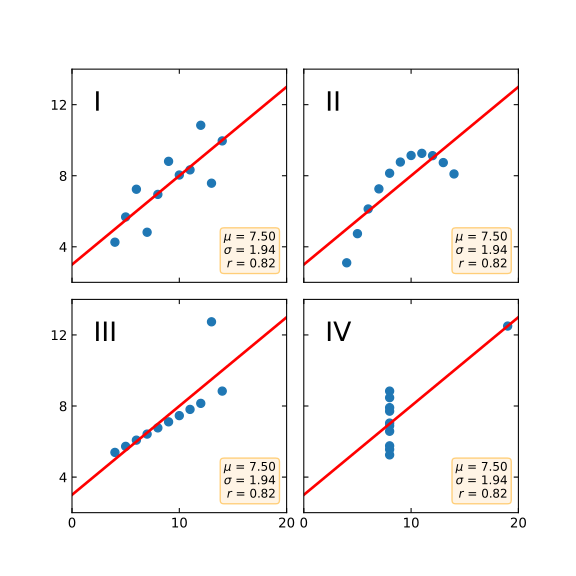
Faceted Scatter Plots: all in one plot#
The Python code for the example below can be found online in the DataXlCalcNet repository or in the corresponding local DataXlCalcNet folder in the file D03_FacetedScatterPlot1.py, and the XML code in the file D03_FacetedScatterPlot1.2D.xml.
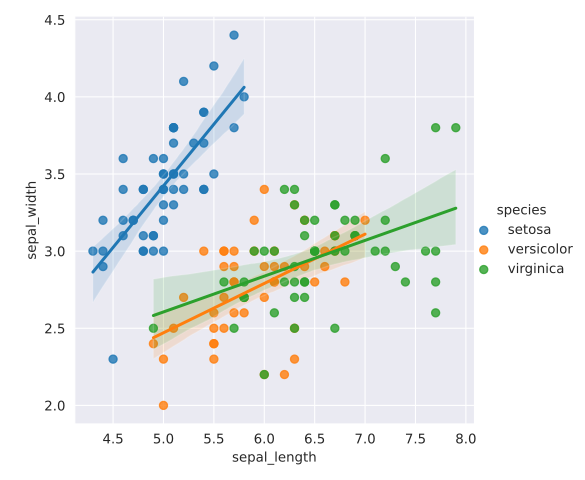
Some text
Faceted Scatter Plots: separate plots#
The Python code for the example below can be found online in the DataXlCalcNet repository or in the corresponding local DataXlCalcNet folder in the file D04_FacetedScatterPlot2.py, and the XML code in the file D04_FacetedScatterPlot2.2D.xml.
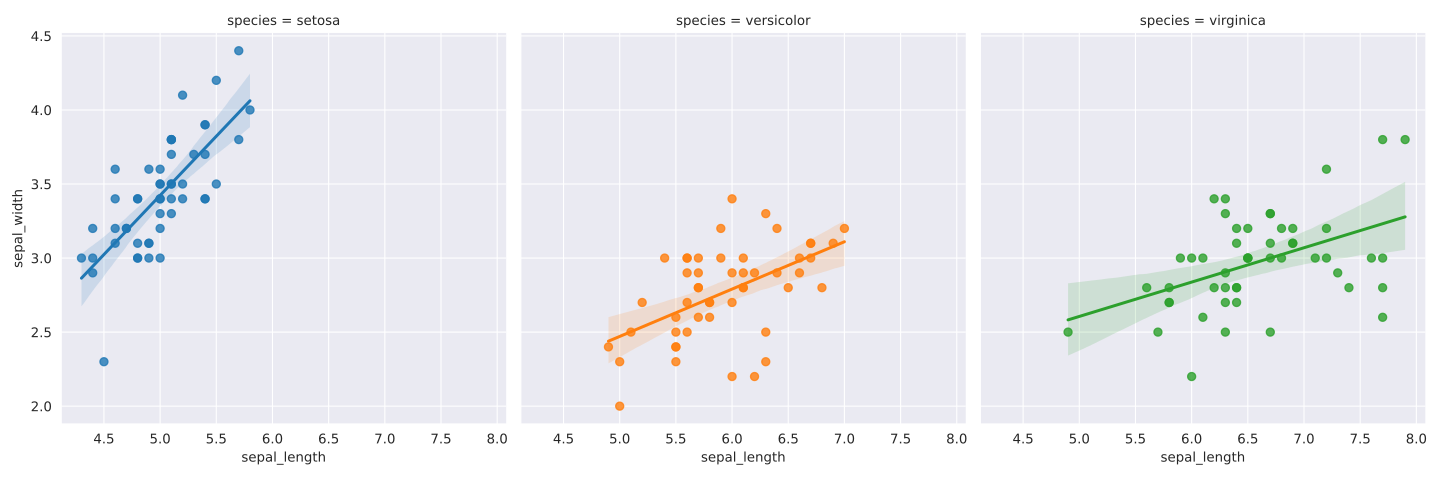
Some text
Faceted Scatter Plots: further subgrouping#
The Python code for the example below can be found online in the DataXlCalcNet repository or in the corresponding local DataXlCalcNet folder in the file D05_FacetedScatterPlot3.py, and the XML code in the file D05_FacetedScatterPlot3.2D.xml.
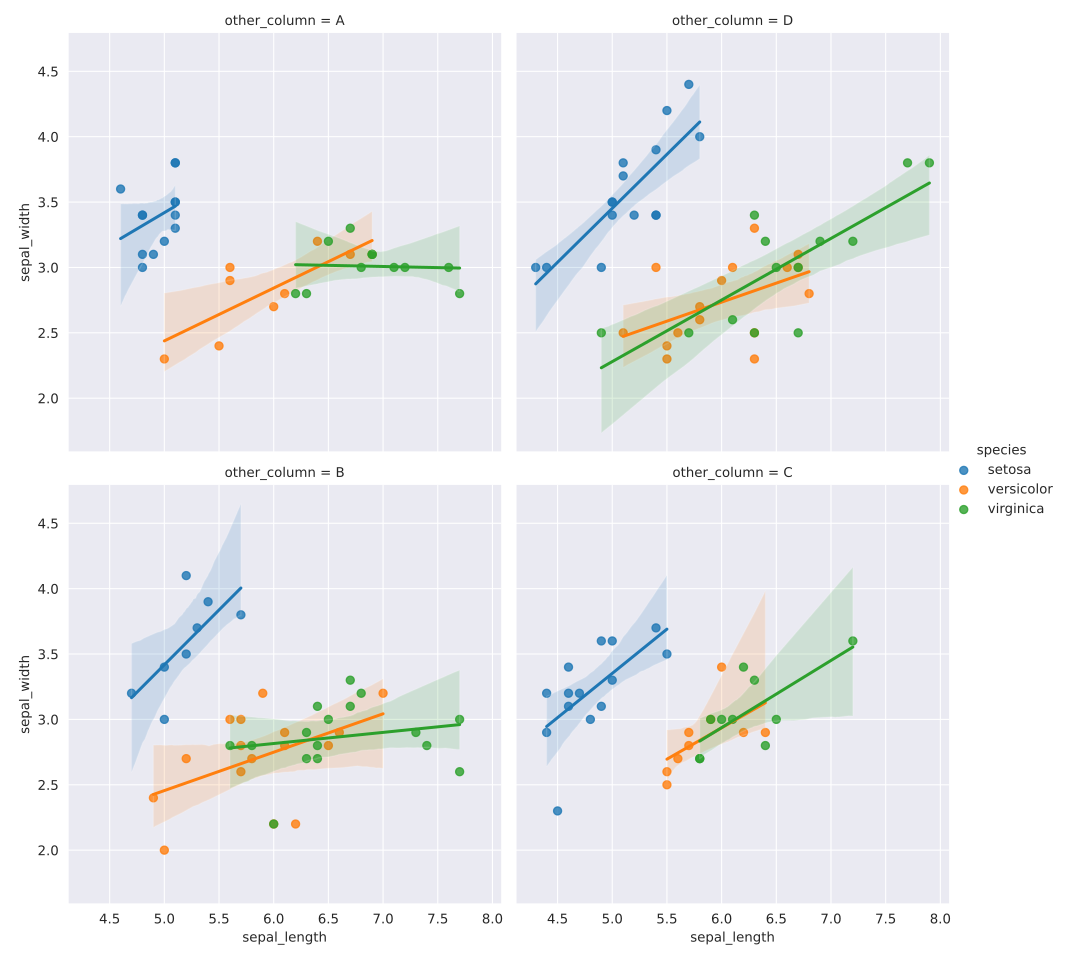
Some text
Bubbleplot#
The Python code for the example below can be found online in the DataXlCalcNet repository or in the corresponding local DataXlCalcNet folder in the file D06_Bubbleplot.py, and the XML code in the file D06_Bubbleplot.2D.xml.
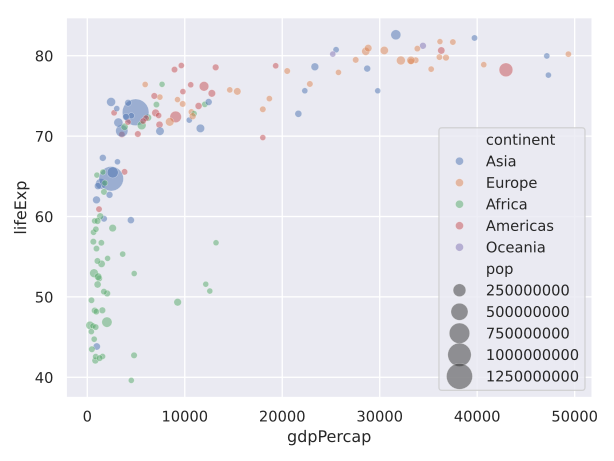
Scatterplot with fancy formatting#
The Python code for the example below can be found online in the DataXlCalcNet repository or in the corresponding local DataXlCalcNet folder in the file D07_ScatterplotWithFancyFomatting.py, and the XML code in the file D07_ScatterplotWithFancyFomatting.2D.xml.
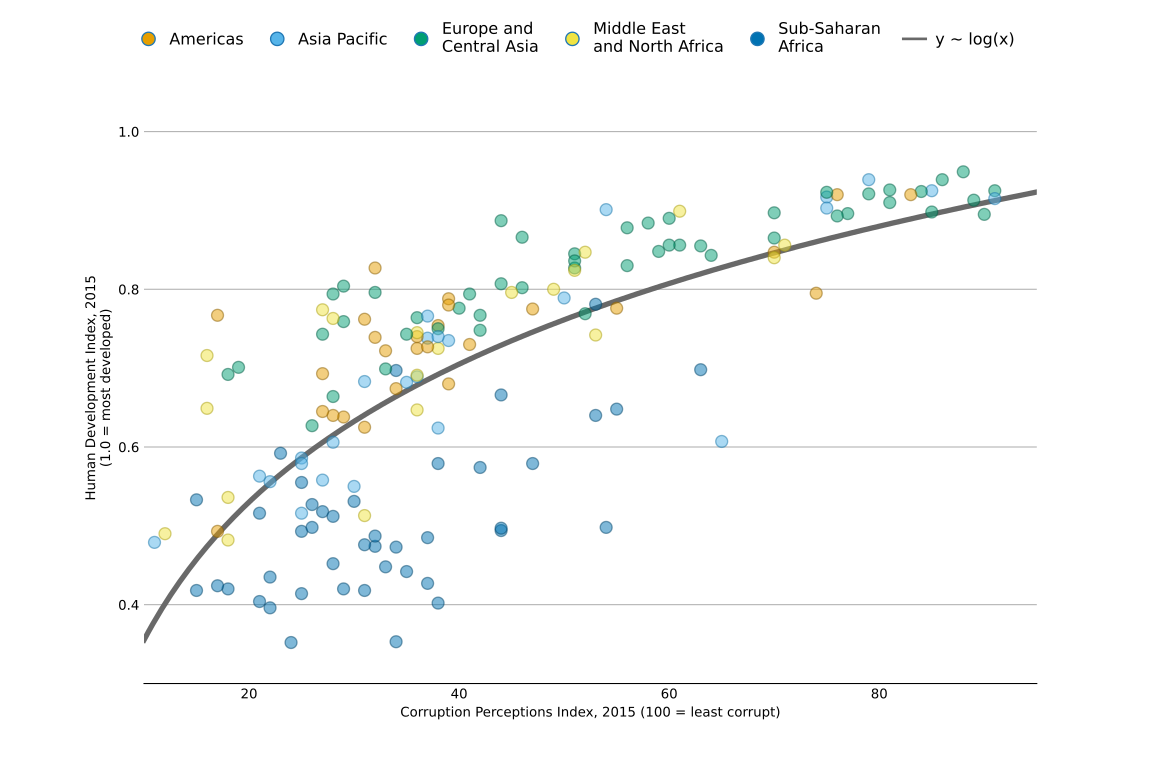
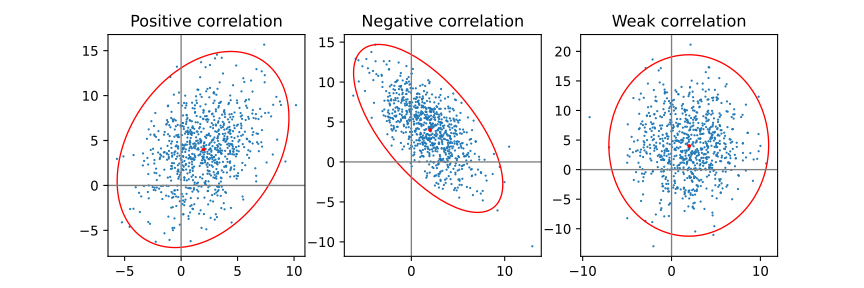
Scatterplots with positive, negative and weak correlation: confidence ellipses#
The Python code for the example below can be found online in the DataXlCalcNet repository or in the corresponding local DataXlCalcNet folder in the file D08_ConfidenceEllipse.py, and the XML code in the file D08_ConfidenceEllipse.2D.xml.
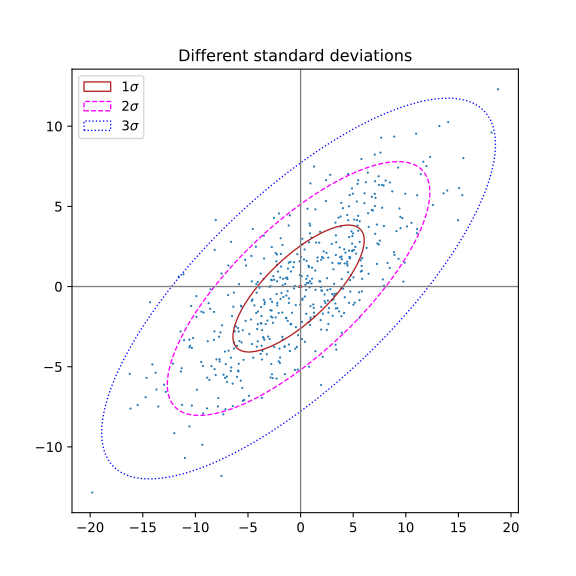
Scatterplot with confidence confidence ellipses at different standard deviations#
The Python code for the example below can be found online in the DataXlCalcNet repository or in the corresponding local DataXlCalcNet folder in the file D09_ConfidenceEllipse2.py, and the XML code in the file D09_ConfidenceEllipse2.2D.xml.
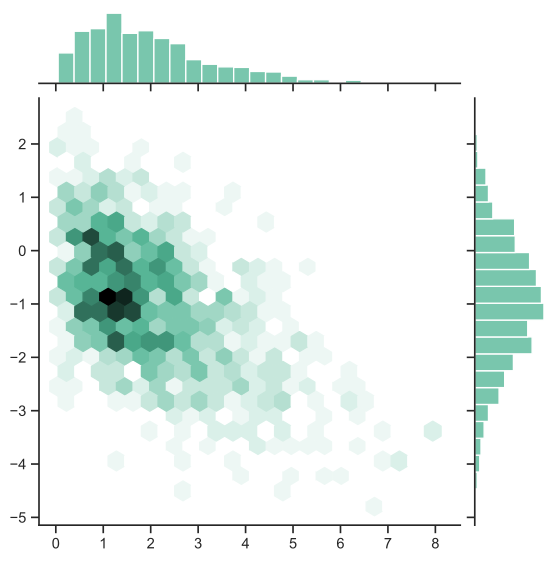
Hexagonal binned plot and marginal histograms (Seaborn)#
The Python code for the example below can be found online in the DataXlCalcNet repository or in the corresponding local DataXlCalcNet folder in the file D10_Hexagonalbinnedplot.py, and the XML code in the file D10_Hexagonalbinnedplot.2D.xml.
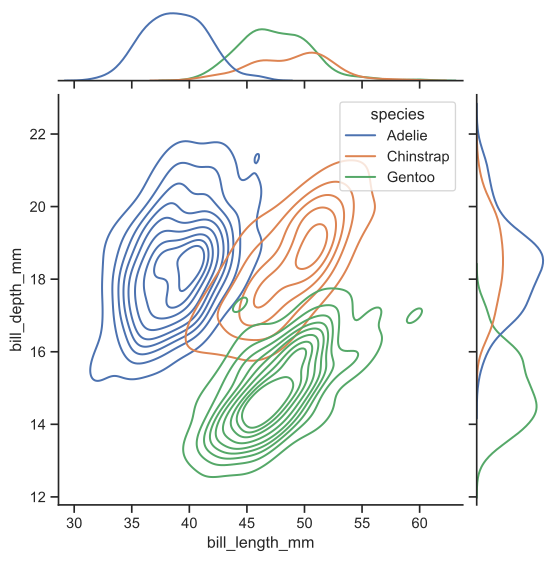
Joint and marginal Kde (Seaborn)#
The Python code for the example below can be found online in the DataXlCalcNet repository or in the corresponding local DataXlCalcNet folder in the file D11_JointAndMarginalKde.py, and the XML code in the file D11_JointAndMarginalKde.2D.xml.
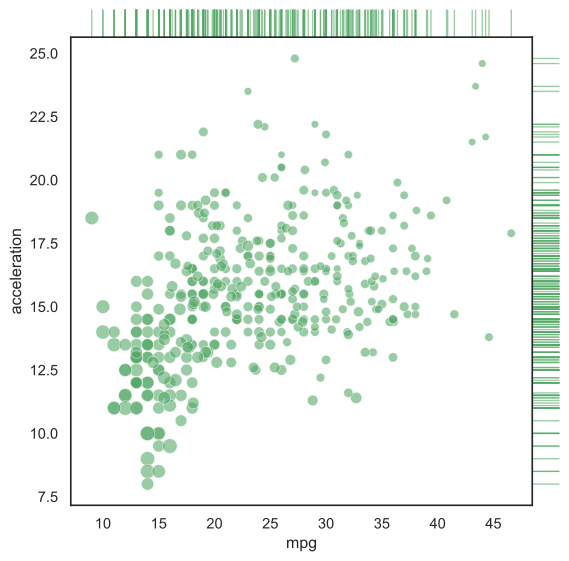
Marginal ticks#
The Python code for the example below can be found online in the DataXlCalcNet repository or in the corresponding local DataXlCalcNet folder in the file D12_MarginalTicks.py, and the XML code in the file D12_MarginalTicks.2D.xml.
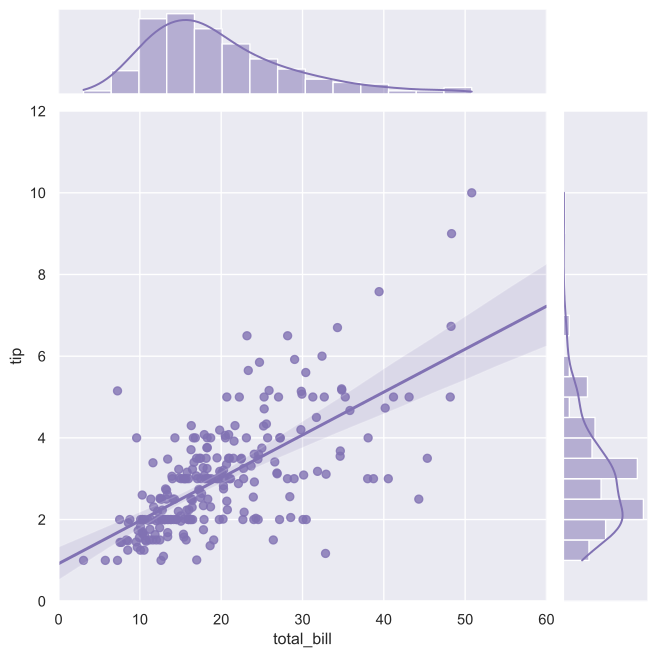
Regression_marginals (Seaborn)#
The Python code for the example below can be found online in the DataXlCalcNet repository or in the corresponding local DataXlCalcNet folder in the file D13_RegressionMarginals.py, and the XML code in the file D13_RegressionMarginals.2D.xml.
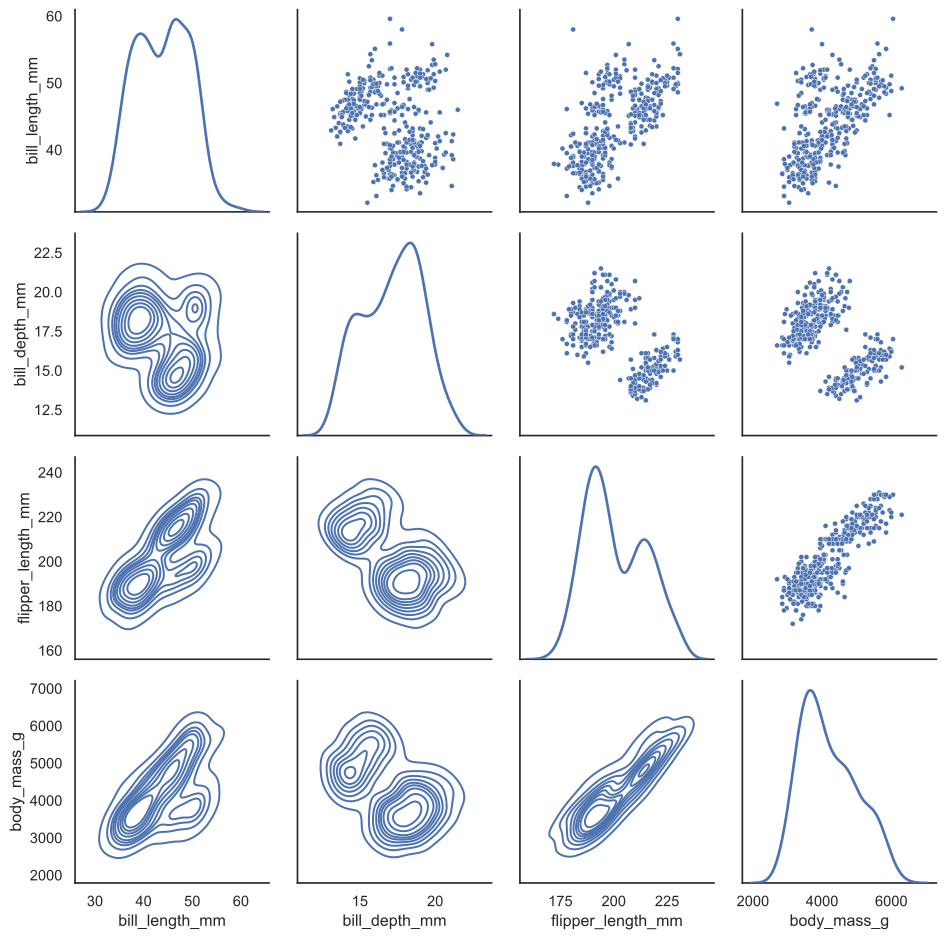
Pair grid with kde (Seaborn)#
The Python code for the example below can be found online in the DataXlCalcNet repository or in the corresponding local DataXlCalcNet folder in the file D14_PairGridWithKde.py, and the XML code in the file D14_PairGridWithKde.2D.xml.
Scatterplot matrix (Seaborn)#
The Python code for the example below can be found online in the DataXlCalcNet repository or in the corresponding local DataXlCalcNet folder in the file D15_ScatterplotMatrix.py, and the XML code in the file D15_ScatterplotMatrix.2D.xml.