Using XlCalcNet within MS Excel#
Preparing MS Excel for using XlCalcNet#
Important
Before beginning to install the MS Excel addins, make sure that the socket server is up and running as expected (see the section above). When calling a function, which calls the socket server, for the first time, MS Excel will seem to freeze if the socket server does not respond quickly. However, subsequent calls will return quickly when the socket server is not up and running (there seems to be a learning effect).
To enable the use of XlCalcNet in MS Excel, two add-ins need to be installed: the first, named Mpfunlablocal.xlam, contains functions written in Visual Basic for Applications (VBA), including functions populating the XlCalcNet Navigator dialog, and is intended to be modified by the user during normal use. This add-in is located in a subfolder of the DataXlCalcNet folder in the Documents folder: DataXlCalcNet\SpreadsheetAddins\MSExcel.
The second, named Mpfunlab.xll, contains the functionality behind the spreadsheet functions CPY_0 - CPY_9 and ASDOUBLE and the XlCalcNet Navigator dialog container. The files comprising the whole add-in (Mpfunlab.xll, ExcelDna.Integration.dll, MpFunLabAddin64.dll, MpFunLabClient.dll, MpFunLab.Dna) have been compiled using Visual Studio and are NOT intended to be modified by the user during normal use. This add-in is located in the Bin folder in the XlCalcNet package: PathToPython\Lib\site-packages\xlcalcnet\Addin\NET48\Bin, where PathToPython is the path to the Python installation (in our example C:\Python313).
Installing Mpfunlablocal.xlam and Mpfunlab.xll#
To install these two add-ins properly, follow these steps:
Again, make sure that the socket server is up and running.
Within MS Excel, on an Excel worksheet, open the Add-ins dialog from the main menu/ribbon: Developer -> Excel Add-ins. In the Add-ins dialog,
click on Browse... and in the Documents folder navigate to the folder DataXlCalcNet\SpreadsheetAddins\MSExcel. Double-click on Mpfunlablocal.xlam, which will then appear in the Add-ins dialog under “Add-ins available”. Still in the Add-ins dialog,
click on Browse... again, and navigate to the folder PathToPython\Lib\site-packages\xlcalcnet\Addin\NET48\Bin (see above). Double-click on MpFunlab.xll, which will then appear in the Add-ins dialog under “Add-ins available”. Still in the Add-ins dialog,
click on OK. Exit MS Excel.
When starting MS Excel the next time, both add-ins will be loaded.
Using the Python standard library functions within spreadsheet formulas#
Note
In the following subsections, we will work with the file XlDemoCPYstd.xlsx, which contains examples for using the Python standard library. More advanced examples using Numpy, Matplotlib, Pandas, Scipy, Seaborn and XlCalcNet start here.
Within MS Excel, open from the main menu File -> Open in the Documents folder the MS Excel workbook DataXlCalcNet\DataExamples\MainExamples\Workbooks\XlDemoCPYstd.xlsx.
This file contains several worksheets which demonstrate different possibilities of using the Python standard library within MS Excel spreadsheet formulas.
Before we start with that we will briefly explore the use of these functions with the Function Dialog of MS Excel: In the worksheet “Math”, select cell B12 and click on the icon of the Function Dialog in the Formula Bar. This opens the Function Dialog:
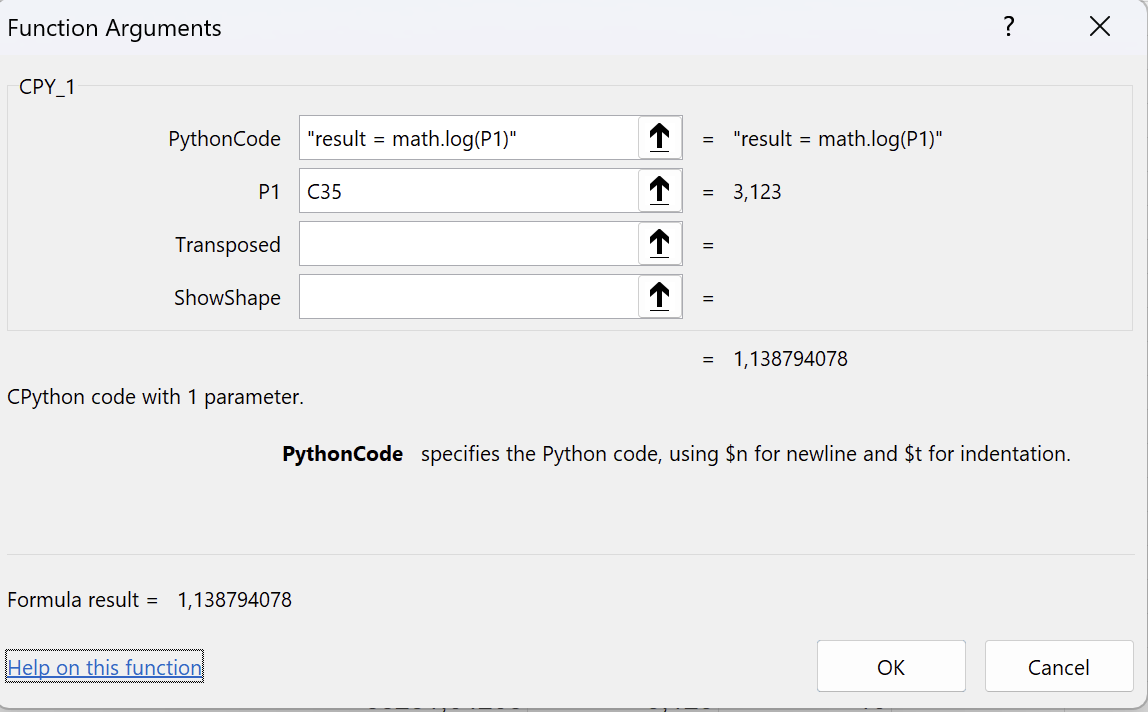
We see that the formula in the spreadsheeet cell is =CPY_1("result = math.ceil(P1)",C12). The function CPY_1 has a required string parameter, Formula, which contains a Python script. This python script can contain several Python statement. The last statement is always expected to assign a value to the variable result, in this case a Python float, which is coverted to a floating point number in double precision (a “Double”) in LibreOffice. The next optional parameter, Param1, can be a string, a Double, a Boolean value or a reference. In this case, it is a reference (C12) which points to a Double with the value 3.123. This optional parameter, Param1, is referenced in the Python formula given above as P1. The last but one parameter, Transposed, and the last parameter, ShowShape, are only relevant when arrays are returned; this is discussed here.
In the worksheet “Math”, select an emptz cell and click on the icon of the Function Dialog in the Formula Bar. This opens the Function Insert Dialog:
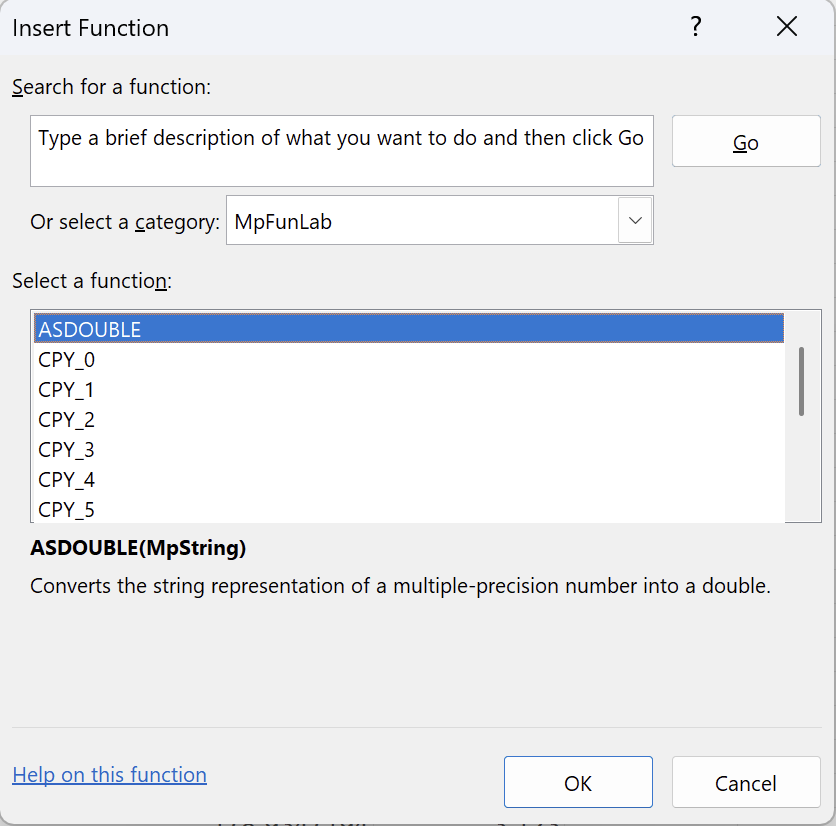
We see that the function CPY_1 is in the Category “MpFunLab”, and that there are 10 functions, CPY_0 to CPY_9, which differ only by the number of parameters Param1 to Param9 which they support (The function CPY_0 does not have a parameter Param0). There is also a function ASDOUBLE, which is used to convert string representations of a Python Fraction or Decimal into a Double; this is discussed here.
The worksheet “GeneralInfo”#
The worksheet “GeneralInfo” contains calls to the Python modules os, platform and sys.
For example, the cell B4 contains the formula =CPY_0("result = platform.processor()"). The function result depends on the hardware, e.g. Intel64 Family 6 Model 165 Stepping 5, GenuineIntel.
The cell B16 contains the formula =CPY_0("result = os.getcwd()"). The function result depends on the LibreOffice installation, e.g. C:\Program Files\LibreOffice\program.
The cell B33 contains the formula =CPY_0("result = str(sys.float_info.epsilon)"), which return the machine epsilon in double precision. The function result is: 2.220446049250313e-16.
The worksheet “Math”#
The worksheet “Math” demonstrates the use of the Python module math and the use of parameters in functions.
For example, the cell B33 contains the formula =CPY_1("result = math.exp(P1)-1",C33), which calculates \(\exp(\text{P1})-1\) naively. The function result is 1.00000500000696E-05, with the cell C33 containing the value 0.00001.
The cell B34 contains the formula =CPY_1("result = math.expm1(P1)",C34), which calculates \(\exp(\text{P1})-1\) using the expm1 function. The function result is 1.00000500001667E-05, with the cell C34 again containing the value 0.00001.
The floating point values NaN, +inf and -inf are not supported in spreadsheet programs, which only return #NUM! in these cases. Use the string representation instead. This is shown in the cells A4:B9 on this worksheet.
The cell B36 contains the formula =CPY_2("result = math.log(P1, P2)",C36, D36), with the cell C36 containing the value 3.123 and the cell D36 containing the value 10. The function result is: 0.494571984230199.
The worksheet “Arrays”#
The worksheet “Arrays” demonstrates the use of arrays in functions. The Python equivalent of arrays are lists.
For example, the cell B3 contains the formula =CPY_0("result = str(sys.path)"). The function sys.path returns a list of strings (containing the entries of the Python path), which is converted into one string by writing str(sys.path). This makes sure that the result can be displayed in one cell, but the result string is quite long and hard to read.
We can use an array formula to improve readability. We recall that in addition to the usual parameters P1 - P9 in the functions CPY_0 to CPY_9 there are two more: The last but one paramter, named Transposed, which is optional with default value 0, where a non-zero value means that the returned array should be transposed; and the last paramter, named ShowShape, which is optional with default value 0, where a non-zero value means that the shape of the returned array should be indicated like R7C3 for an array with 7 rows and 3 columns.
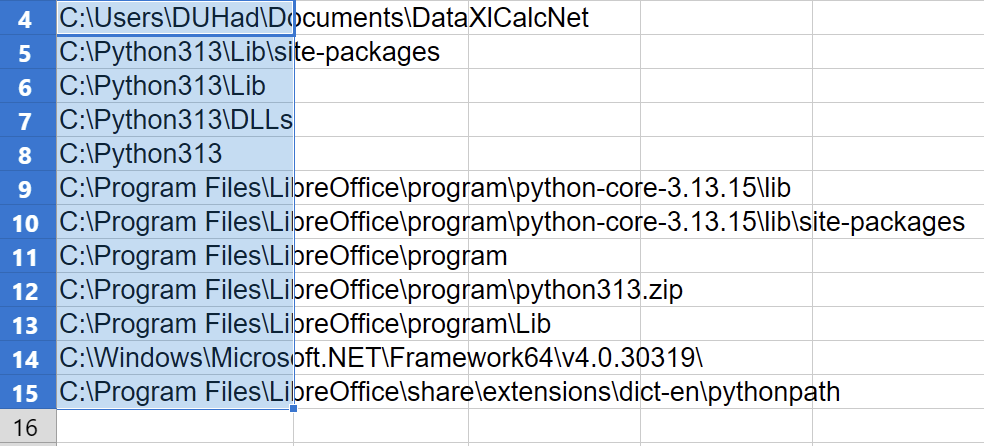
As an example, the cell B6 contains the formula =CPY_0("result = sys.path",1,1) and returns the shape information R12C1 followed by the separator |, followed by the first entry of the transposed array, i.e. in this case R12xC1| C:\Users\DUHad\Documents\DataXlCalcNet.
We can build the corresponding array formula by first selecting a range like R12C1, then typing in the input line of the formula bar =CPY_0("result = sys.path",1,0), and finally, while keeping the shift and control keys pressed down, pressing the enter key.
This is what has been done in cells B9:B20. The formula is now displayed as {=CPY_0("result = sys.path",1,0)}, with curly braces, to indicate that it is an array formula. We can change the range which is covered by the array formula by dragging the small blue rectangle in the lower right corner in the selected range (see the screenshot below).
The worksheet “Data”#
The worksheet “Data “ demonstrates the use of named ranges in MS Excel spreadsheet formulas.
Currently there a two small datasets with predefined as named ranges: matA defined as the range $Data.$A$3:$A$7 and matB defined as the range $Data.$A$3:$A$7.
These ranges are used in the workbook “Arrays”.
Using Numpy, Matplotlib, Pandas, Scipy, Seaborn and XlCalcNet within spreadsheet formulas#
Note
In the following subsections. we will work with the file XlDemoCPYadv.xlsx, which contains more advanced examples using Numpy, Matplotlib, Pandas, Scipy, Seaborn and XlCalcNet. Examples for using MS Excel with the Python standard library start here.
Within MS Excel, open from the main menu File -> Open in the Documents folder the MS Excel workbook DataXlCalcNet\DataExamples\MainExamples\Workbooks\XlDemoCPYadv.xlsx.
This file contains several worksheets which demonstrate different possibilities of using Numpy, Matplotlib, Pandas, Scipy, Seaborn and XlCalcNet within MS Excel spreadsheet formulas.
Some of these functions write their output into the XlCalcNetIDE\OutputMonitor folder in the AppDataLocal folder. In order to see it, we need to open the Output Monitor application: start the Tiny IDE by clicking on its icon in the task bar, and in the main menu, click on Tools -> Start Output Monitor.
The worksheet “MpInput”#
The worksheet “MpInput “ demonstrates the use of named ranges in MS Excel spreadsheet formulas.
If we try to enter a number like 123456789012345678/901234567890, i.e. a number with more than 16 digits into a spreadsheet cell, it will automatically be shortened to 1.23456789012346E+029. In order to be able to enter such numbers into spreadsheet cells, the cells must first be formatted as text, and thereafter these numbers can be entered as text. This is mostly useful when working with Python Fractions and Decimals.
As an example, worksheet “MpInput” contains a named range called “MpInputFractions” in column A, which can be used as input for descriptive statistics or linear algebra routines.
However, this kind of input is hard to read; it is also not directly usable for numerical spreadsheet functions. This can be changed by using the function ASDOUBLE, a shown in column B
The worksheet “Programming”#
The worksheet “Programming” demonstrates the use of small python scripts in MS Excel spreadsheet formulas.
=CPY_0("temp = 0 $n for i in range(14): $n$t temp += i $n result = 2 * temp") is the formula in the cell B3. Here we are using $n for newline and $t for indentation; the result is 182. The corresponding Python code with conventional formatting would look like this:
temp = 0
for i in range(14):
    temp += i
result = 2 * temp
=CPY_1("temp = 0 $n for i in range(int(P1)): $n$t temp += i $n result = 2 * temp", C4) is the formula in the cell B4, and the cell C4 contains the value 45; the result is 1980. The corresponding Python code with conventional formatting would look like this:
temp = 0
for i in range(int(P1)):
    temp += i
result = 2 * temp
=CPY_0("from xlcalcnet import mpm $n mpm.dps=40 $n result = str(mpm.sqrt(2))") is the formula in the cell B8; the result is 1.41421356237309504880168872420969807857. The corresponding Python code with conventional formatting would look like this:
from xlcalcnet import mpm
mpm.dps=40
result = str(mpm.sqrt(2))
=CPY_0("from scipy.integrate import quad $n def integrand(x, a, b): return a*x**2 + b $n a = 2.1; b = 1.1; $n I = quad(integrand, 0, 1, args=(a,b)) $n result = str(I) ") is the formula in the cell B12; the result is the tuple (1.8000000000000003, 1.998401444325282e-14), where the first item is the value of the integral and the second item is the error estimate. The corresponding Python code with conventional formatting would look like this:
from scipy.integrate import quad
def integrand(x, a, b): return a*x**2 + b
a = 2.1; b = 1.1;
I = quad(integrand, 0, 1, args=(a,b))
result = str(I)
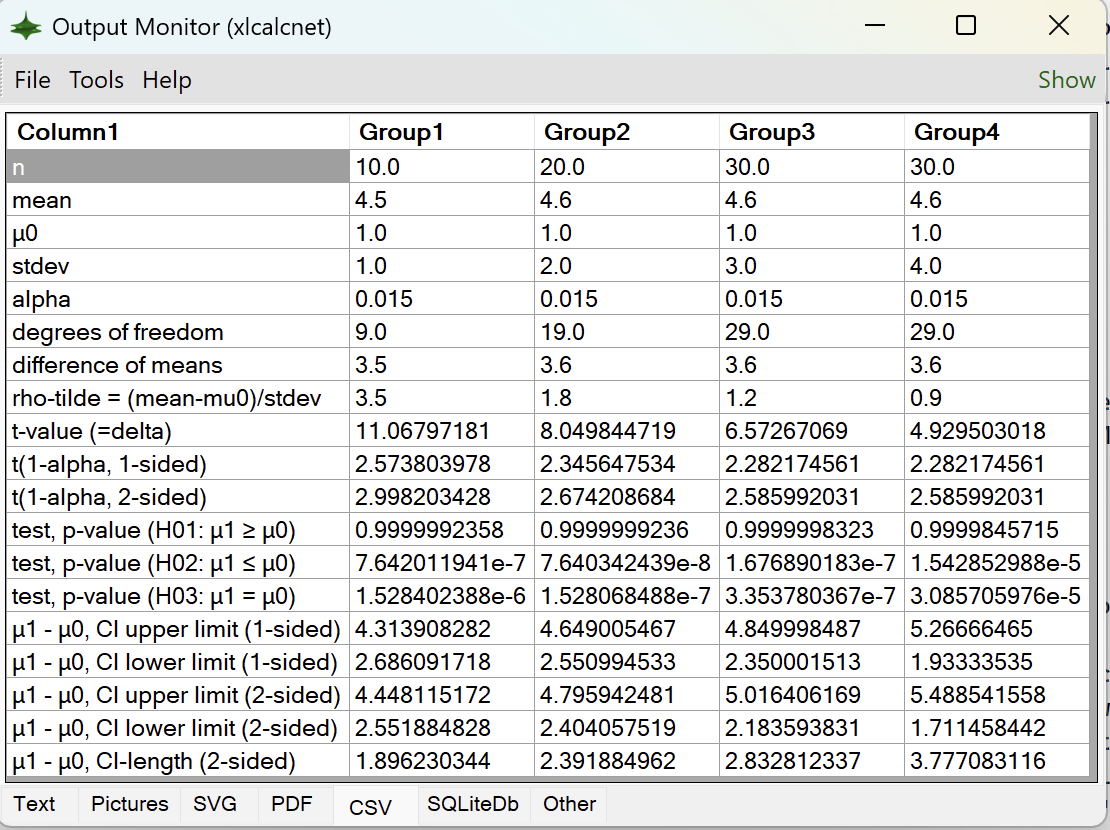
=CPY_0("from A06_UserlibExamplesPython.B29_InferentialStatistics.C01_BasicTests1Sample import D01_StudentT_PValues $n D01_StudentT_PValues.demo_stats_student_t_1sample_test() $n result='Done'") is the formula in the cell B17; the result is a CSV file which is written to the Output Monitor folder. The corresponding Python code with conventional formatting would look like this:
from A06_UserlibExamplesPython.B29_InferentialStatistics.C01_BasicTests1Sample import D01_StudentT_PValues
D01_StudentT_PValues.demo_stats_student_t_1sample_test()
result='Done'
And this is the Output Monitor showing the result (with the project panel hidden)
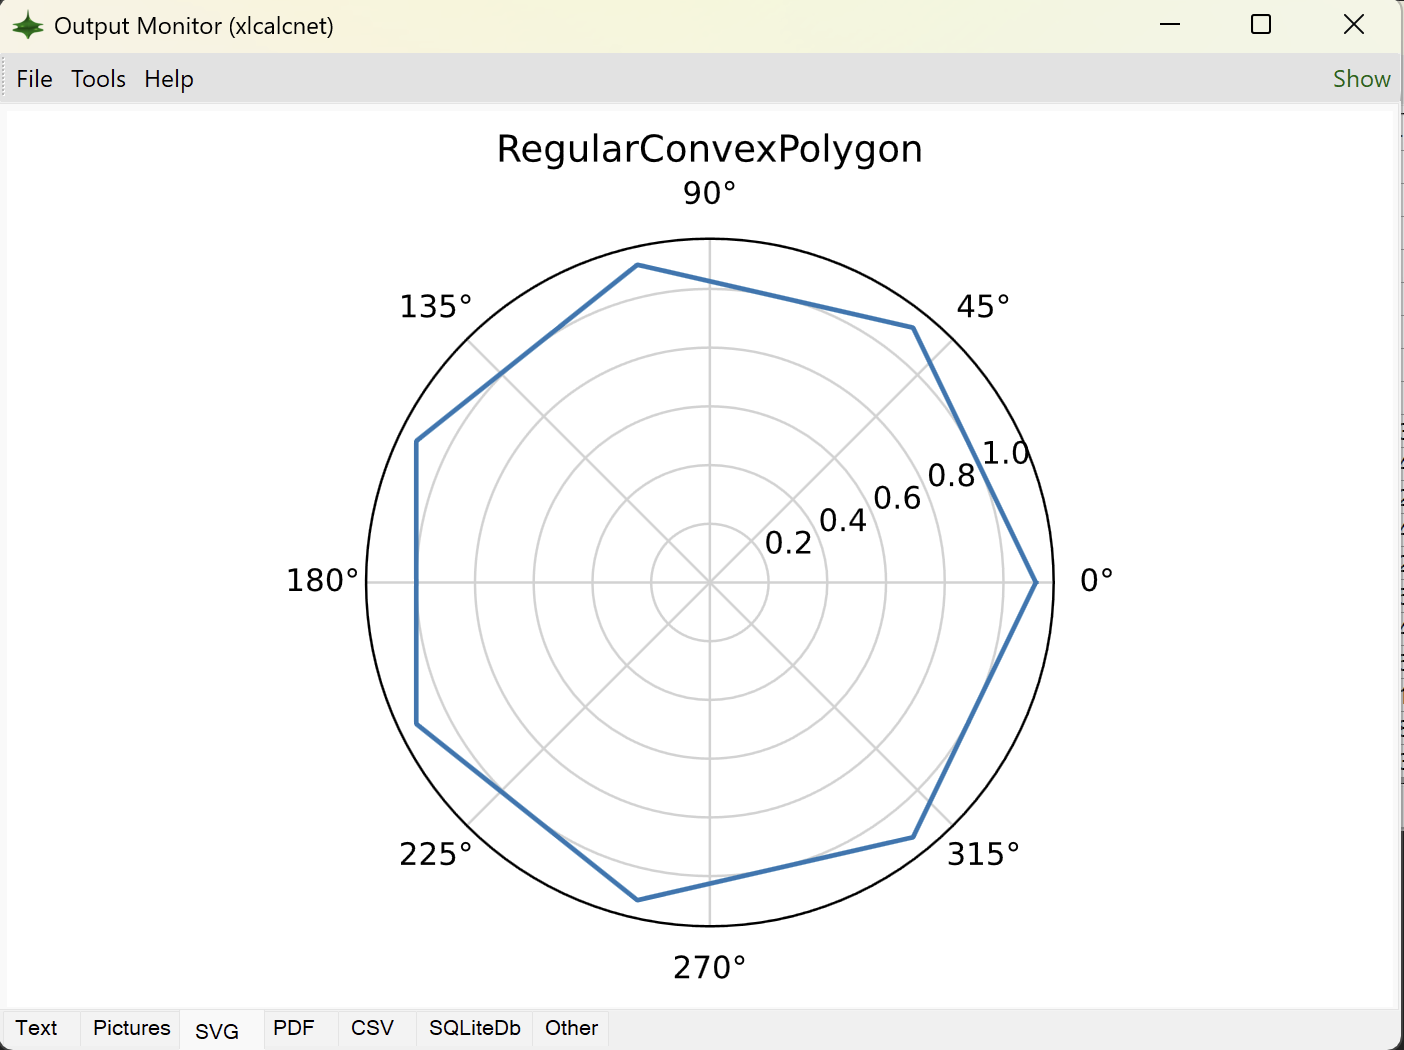
=CPY_0("from A01_ExamplesPython.B18_FunctionsAndCurvesPlots.C02_BasicCurves import D01_RegularConvexPolygon $n D01_RegularConvexPolygon.RegularConvexPolygon(OutputMode='svg') $n result='Done'") is the formula in the cell B22; the result is a SVG file which is written to the Output Monitor folder. The corresponding Python code with conventional formatting would look like this:
from A01_ExamplesPython.B18_FunctionsAndCurvesPlots.C02_BasicCurves import D01_RegularConvexPolygon
D01_RegularConvexPolygon.RegularConvexPolygon(OutputMode='svg')
result='Done'
And this is the Output Monitor showing the result (with the project panel hidden)
Managing procedures instead of functions#
It is possible to call the spreadsheet functions CPY_0 to CPY_9 from LibreOffice Basic and to use this to start procedures instead of functions. A few simple examples have already been prepared to demonstrate the technique.
To access the relevant dialog, click on the XlCalcNet logo (in orange) on the main menu bar:
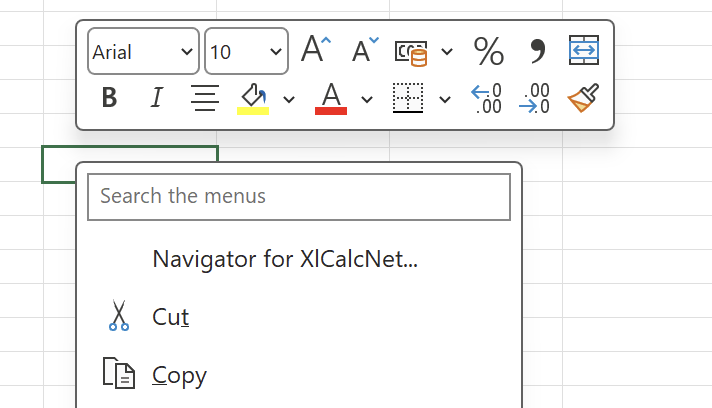
The following dialog box with the title Navigator for XlCalcNet will appear:
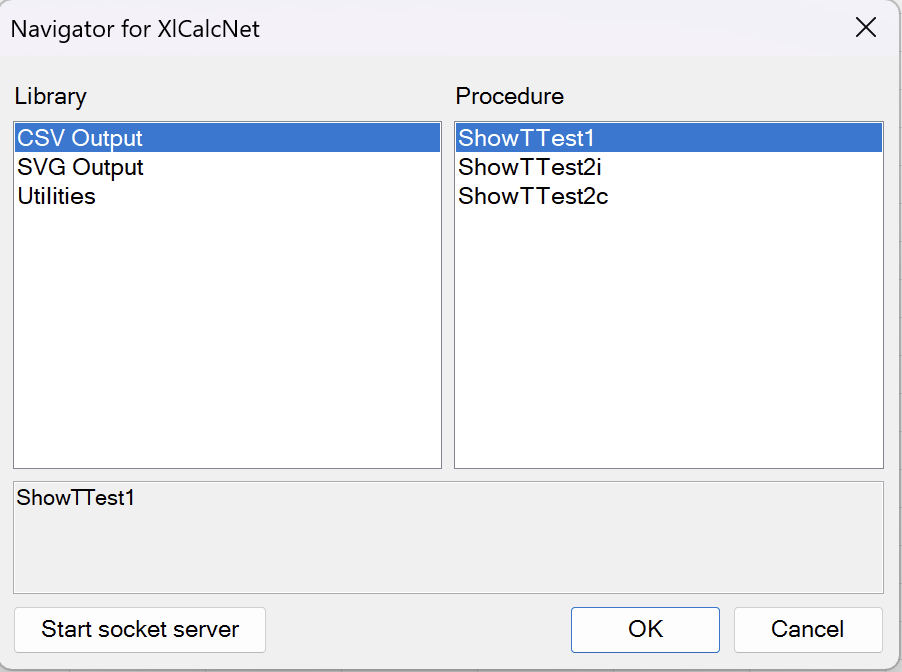
The first example, with CSV Output in “Category” and ShowTTest1 in “Subroutine”, will write a CSV file into the XlCalcNetIDE\OutputMonitor folder in the AppDataLocal folder. In order to see it, we need to open the Output Monitor application: start the Tiny IDE by clicking on its icon in the task bar, and in the main menu, click on Tools -> Start Output Monitor. With the Output Monitor application running, click OK. The CSV file will then immediately appear in the Output Monitor.
The corresponding code in the module MpFunlabLocal -> BasicAndDialogs is shown below:
Sub ShowTTest1()
    Rem Output (a .csv file) is shown in output monitor
    Code = "from A06_UserlibExamplesPython.B29_InferentialStatistics.C01_BasicTests1Sample import D01_StudentT_PValues;"
    Code = Code + "D01_StudentT_PValues.demo_stats_student_t_1sample_test(); result='Done';"
    Result = Application.Run("CPY_0", Code)
    showResult (Result)
End Sub
The second example, with SVG Output in “Category” and ShowPolygon in “Subroutine”, will write a SVG file into the XlCalcNetIDE\OutputMonitor folder in the AppDataLocal folder. With the Output Monitor application running (see above), click OK. The SVG file will then immediately appear in the Output Monitor.
The corresponding code in the module MpFunlabLocal -> BasicAndDialogs is shown below:
Sub ShowPolygon()
    Rem Graphics is shown in output monitor
    Code = "from A01_ExamplesPython.B18_FunctionsAndCurvesPlots.C02_BasicCurves import D01_RegularConvexPolygon;"
    Code = Code + "D01_RegularConvexPolygon.RegularConvexPolygon(OutputMode='svg'); result='Done';"
    Result = Application.Run("CPY_0", Code)
    showResult (Result)
End Sub
Uninstalling#
To uninstall these two extensions properly, follow these steps:
Within MS Excel, on an Excel worksheet, open the Add-ins dialog from the main menu/ribbon: Developer -> Excel Add-ins. In the Add-ins dialog, unselect MpFunlab and Mpfunlablocal, and click on OK. Close MS Excel. When Excel is started the next time these Add-ins will not be loaded, however, they will still appear (unselected) in the Add-ins dialog (this seems to be a decade-old bug/feature). To remove them also from the Add-ins dialog, you need to rename them in their original location, start Excel again, and start the Add-ins dialog again. When you then re-select these unselected items, a dialog stating that the add-in cannot be found will appear, followed by “Delete from list?”. Click on \(Yes\), and the add-in will be removed from the list.