Area Plots#
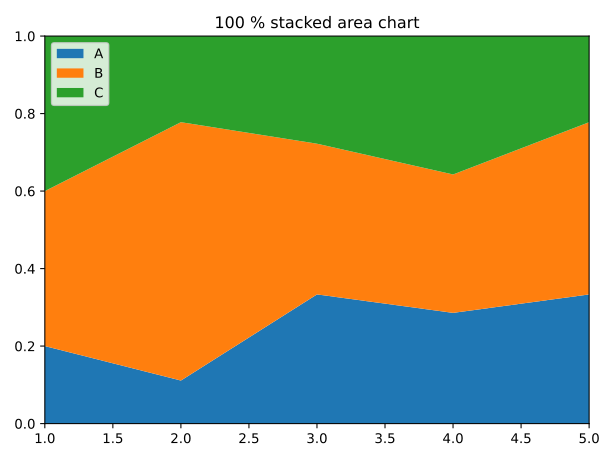
Percentage Stacked Area Chart#
The Python code for the example below can be found online in the DataXlCalcNet repository or in the corresponding local DataXlCalcNet folder in the file D01_PercentageStackedAreaChart.py, and the XML code in the file D01_PercentageStackedAreaChart.2D.xml.
StackedAreaChart1#
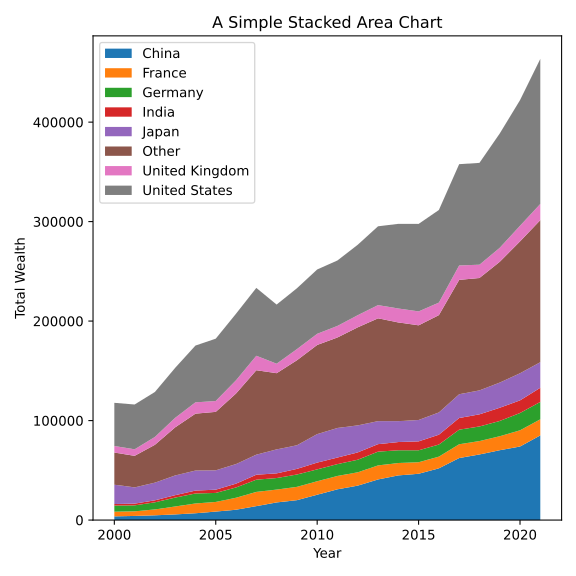
The Python code for the example below can be found online in the DataXlCalcNet repository or in the corresponding local DataXlCalcNet folder in the file D02a_StackedAreaChart1.py, and the XML code in the file D02a_StackedAreaChart1.2D.xml.
The Python code for the example below can be found online in the DataXlCalcNet repository or in the corresponding local DataXlCalcNet folder in the file D02b_StackedAreaChart2.py, and the XML code in the file D02b_StackedAreaChart2.2D.xml.
The Python code for the example below can be found online in the DataXlCalcNet repository or in the corresponding local DataXlCalcNet folder in the file D02c_StackedAreaChart3.py, and the XML code in the file D02c_StackedAreaChart3.2D.xml.
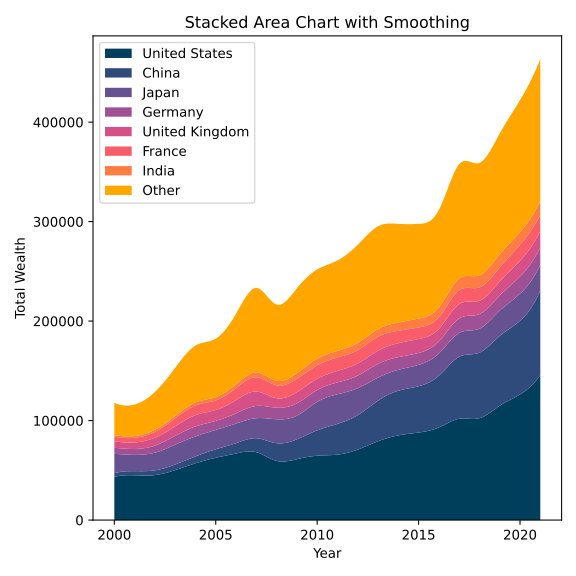
The Python code for the example below can be found online in the DataXlCalcNet repository or in the corresponding local DataXlCalcNet folder in the file D02d_StackedAreaChart4.py, and the XML code in the file D02d_StackedAreaChart4.2D.xml.
 \(\quad\)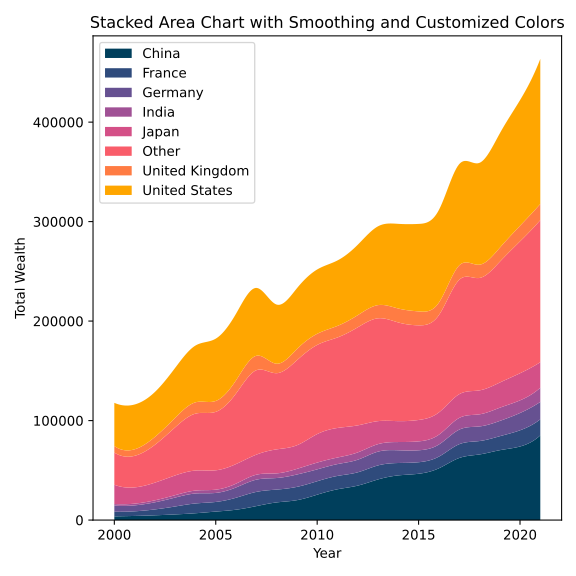
Some text
 \(\quad\)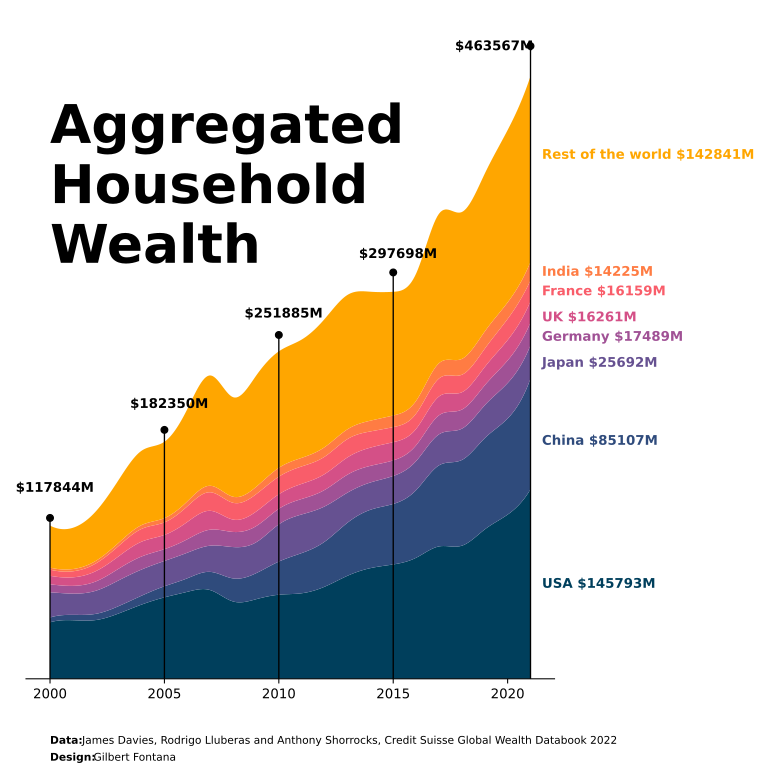
Steam graph#
The Python code for the example below can be found online in the DataXlCalcNet repository or in the corresponding local DataXlCalcNet folder in the file D03a_Steamgraph1.py, and the XML code in the file D03a_Steamgraph1.2D.xml.
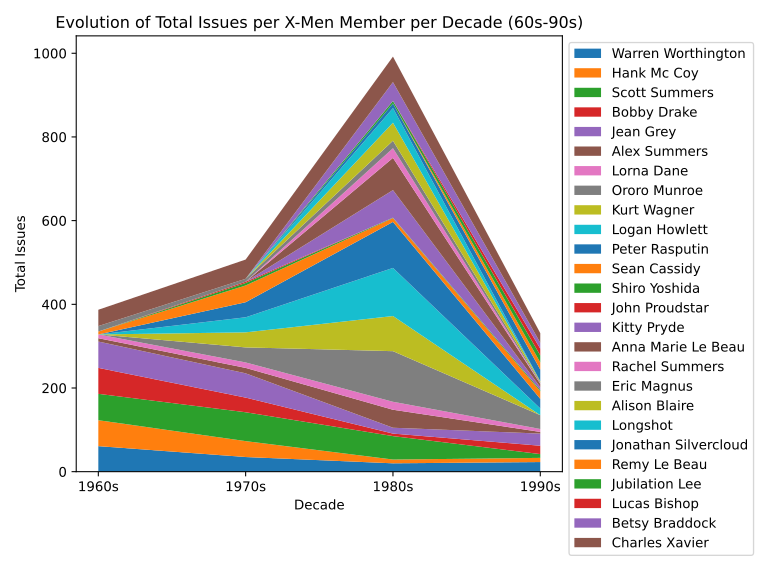
The Python code for the example below can be found online in the DataXlCalcNet repository or in the corresponding local DataXlCalcNet folder in the file D03b_Steamgraph2.py, and the XML code in the file D03b_Steamgraph2.2D.xml.
The Python code for the example below can be found online in the DataXlCalcNet repository or in the corresponding local DataXlCalcNet folder in the file D03c_Steamgraph3.py, and the XML code in the file D03c_Steamgraph3.2D.xml.
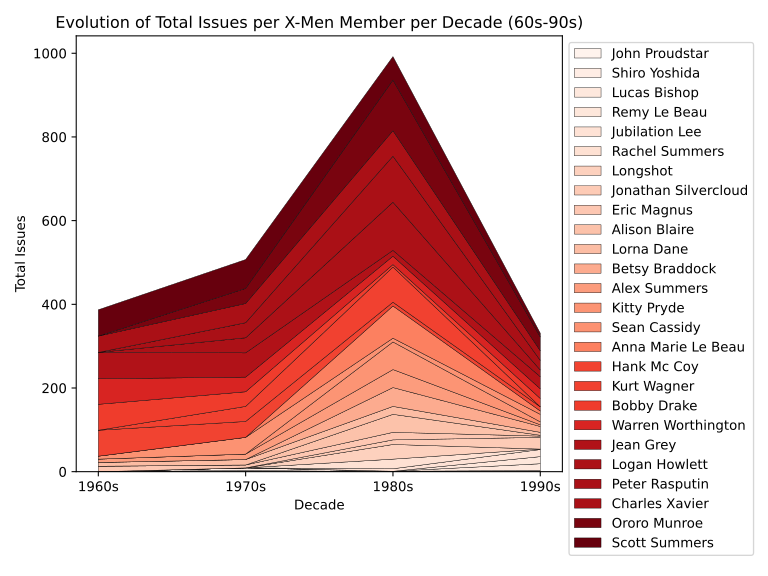
The Python code for the example below can be found online in the DataXlCalcNet repository or in the corresponding local DataXlCalcNet folder in the file D03d_Steamgraph4.py, and the XML code in the file D03d_Steamgraph4.2D.xml.
 \(\quad\)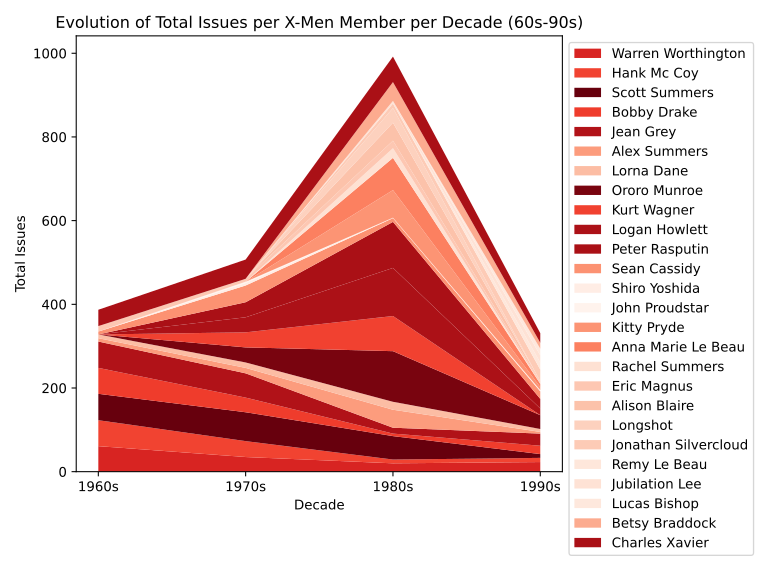
 \(\quad\)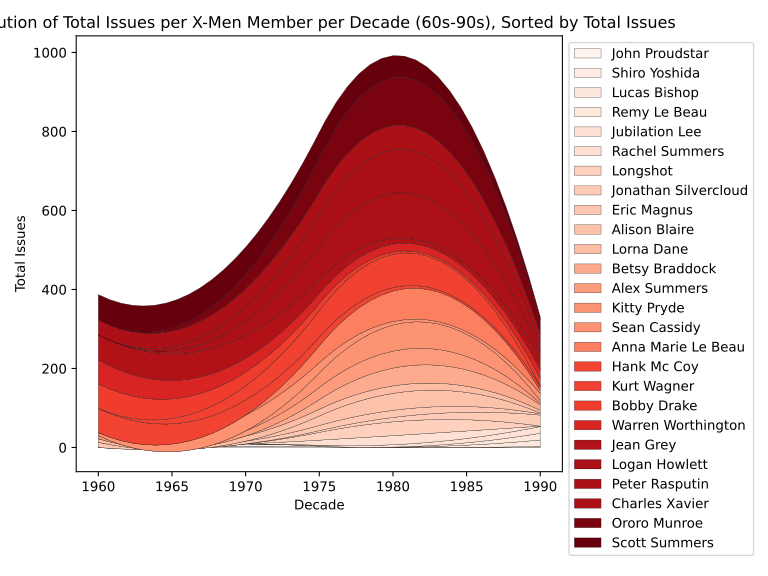
Area Chart#
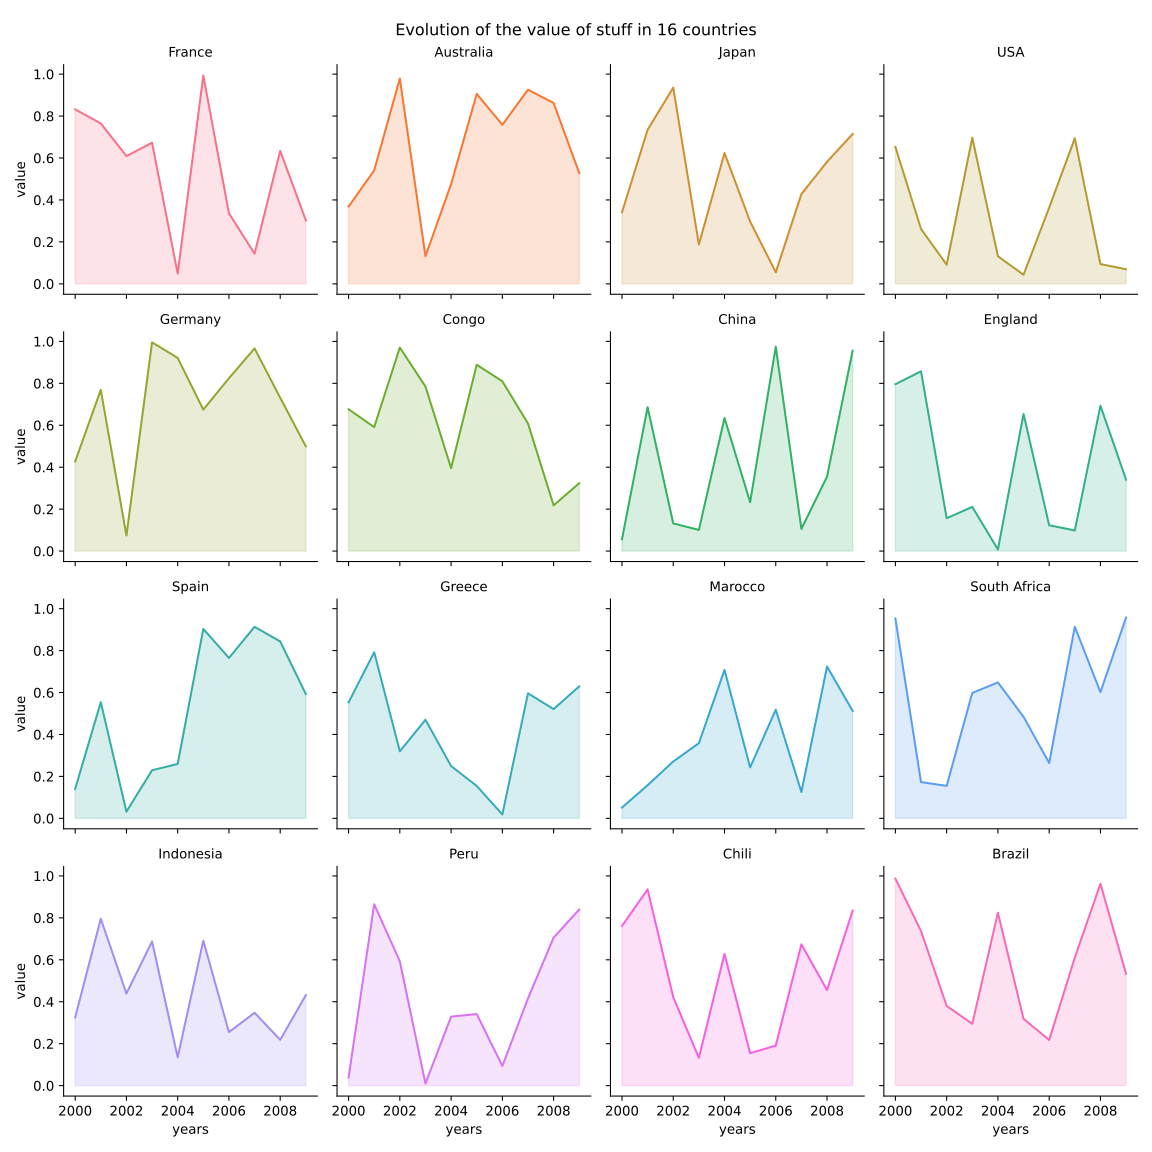
The Python code for the example below can be found online in the DataXlCalcNet repository or in the corresponding local DataXlCalcNet folder in the file D04_MultipleAreaCharts.py, and the XML code in the file D04_MultipleAreaCharts.2D.xml.
Density Chart#
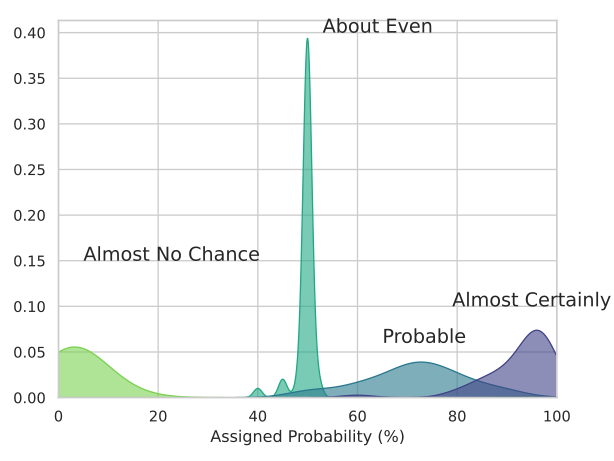
The Python code for the example below can be found online in the DataXlCalcNet repository or in the corresponding local DataXlCalcNet folder in the file D05_DensityChart.py, and the XML code in the file D05_DensityChart.2D.xml.
Ridgetline Plot#
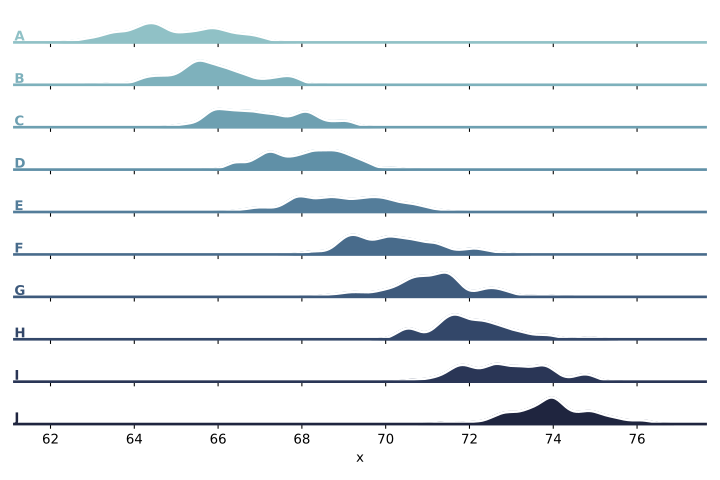
The Python code for the example below can be found online in the DataXlCalcNet repository or in the corresponding local DataXlCalcNet folder in the file D06_RidgetlinePlot.py, and the XML code in the file D06_RidgetlinePlot.2D.xml.
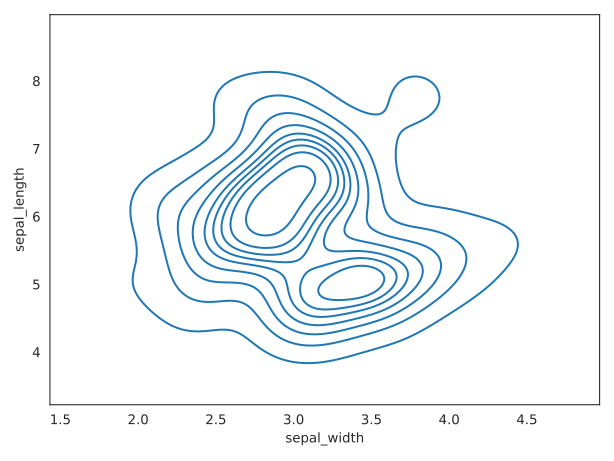
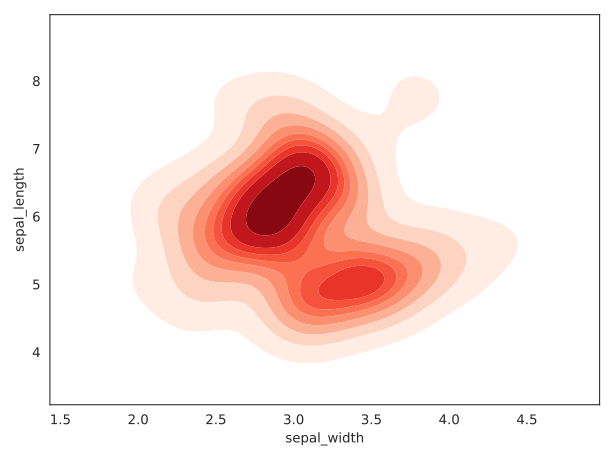
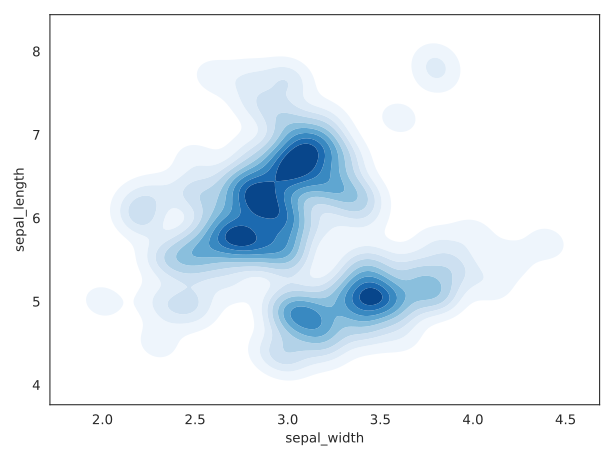
Kde Plot, 3 versions#
The Python code for the example below can be found online in the DataXlCalcNet repository or in the corresponding local DataXlCalcNet folder in the file D07a_KdePlot1.py, and the XML code in the file D07a_KdePlot1.2D.xml.
The Python code for the example below can be found online in the DataXlCalcNet repository or in the corresponding local DataXlCalcNet folder in the file D07b_KdePlot2.py, and the XML code in the file D07b_KdePlot2.2D.xml.
The Python code for the example below can be found online in the DataXlCalcNet repository or in the corresponding local DataXlCalcNet folder in the file D07c_KdePlot3.py, and the XML code in the file D07c_KdePlot3.2D.xml.
Some text
Some text
Some text