A quick look at Matplotlib and related libraries#
Overview#
https://scikit-learn.org/stable/index.html
https://python-graph-gallery.com/
One of Matplotlib’s most important features is its ability to play well with many operating systems and graphics backends. Matplotlib supports dozens of backends and output types, which means you can count on it to work regardless of which operating system you are using or which output format you wish. This cross-platform, everything-to-everyone approach has been one of the great strengths of Matplotlib. It has led to a large userbase, which in turn has led to an active developer base and Matplotlib’s powerful tools and ubiquity within the scientific Python world.
We will use the plt.style directive to choose appropriate aesthetic styles for our figures. Here we will set the classic style, which ensures that the plots we create use the classic Matplotlib style:
plt.style.use('classic')
The available styles are listed in
plt.style.available
The basic way to switch to a stylesheet is to call
plt.style.use('stylename')
But keep in mind that this will change the style for the rest of the session! Alternatively, you can use the style context manager, which sets a style temporarily
with plt.style.context('stylename'):
    make_a_plot()
See also: https://www.oreilly.com/library/view/python-data-science/9781491912126/ch04.html
Using Matplotlib in a spreadsheet formula (without blocking function return)#
MS Excel: TestCPython.xlsx
Seaborn#
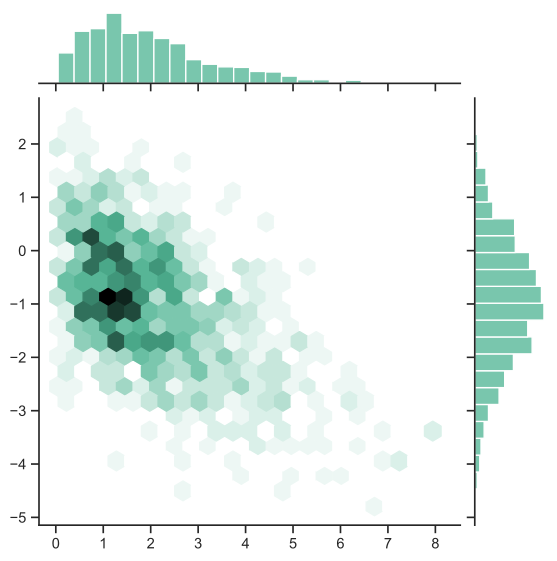 \(\quad\)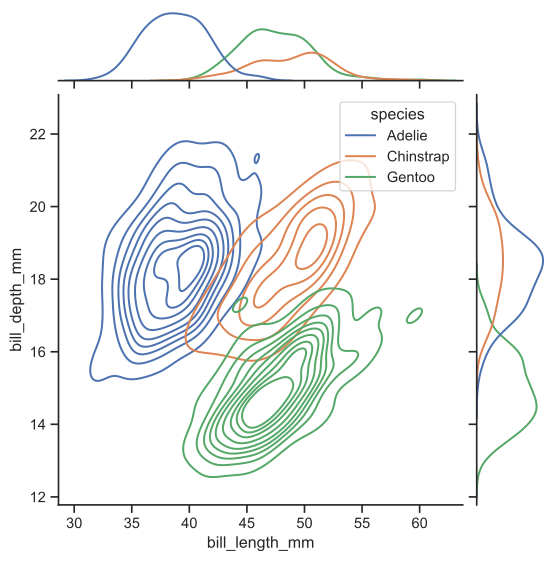
Cartopy#
Some text
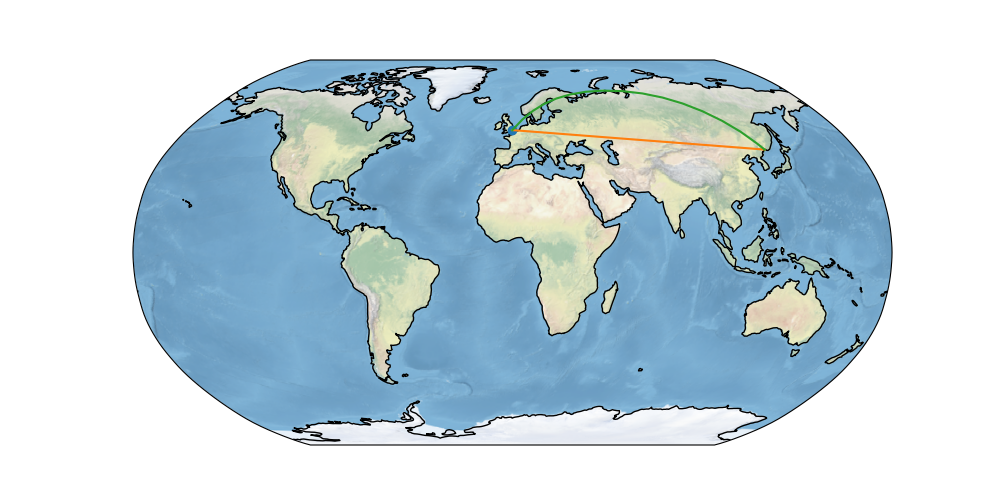
Left figure: picWorldFlight
Networkx#
Some text
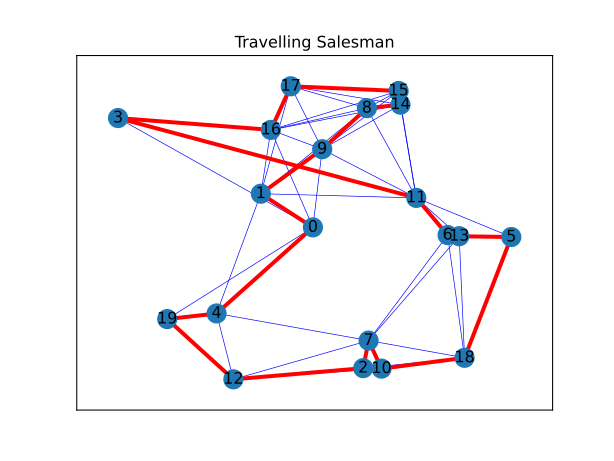
Left figure: Travelling_Salesman
Matplotlib and 3D plots (based on S3dlib)#
See: fzaverl/s3dlib
See: https://s3dlib.org/examples/functional/swirl.html
See: https://s3dlib.org/examples/lines/param_lineset.html
See: https://s3dlib.org/tutorials/render_control/scaling.html
See: https://s3dlib.org/tutorials/render_control/visualization3d.html
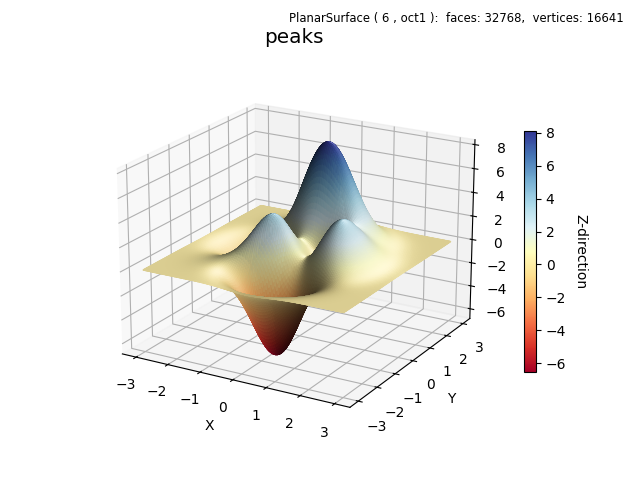
Left figure: Hello_World_Example_2b.