Decorative curves#
Fish curve#
- User.FishCurve(a, Resolution, AsPolar=false)#
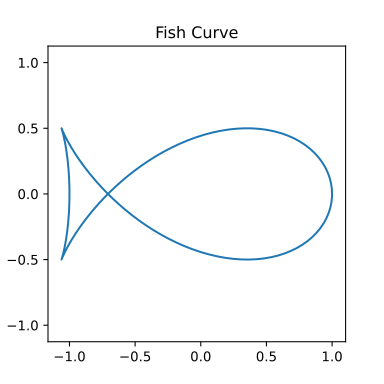
The fish curve has the parametric equation
\[x(t) = a \cos(t) - \frac{a \sin^2(t)}{\sqrt{2}},\]\[y(t) = a \cos(t) \sin(t).\]See also Wikipedia [1493], MathWorld [1137], MathCurve [325].
An example in Python
>>> from mpfunlab import User
>>> Curve = User.Cardioid(a = 1, Resolution = 200, AsPolar = true)
>>> User.Chart2D.Show(Curve, Template = 'PolarCurve', Title = 'Cardioid')
 \(\quad\) \(\quad\)
 Left figure: Fish curve
Middle figure: Fish curve
Right figure: Fish curve
Heart curve#
- User.HeartCurve(a, Resolution, AsPolar=false)#
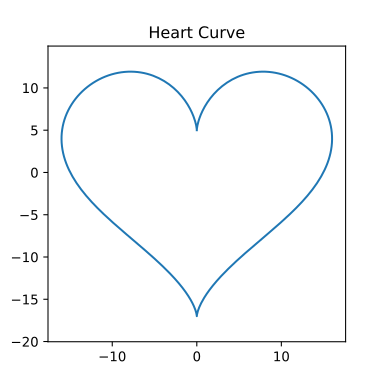
The heart curve has the parametric equation
\[x(t) = 16 \sin^3(t),\]\[y(t) = 13 \cos(t) - 5 \cos(2t) - 2 \cos(3t) - \cos(4t)\]See also Wikipedia [1495], MathWorld [1138].
An example in Python
>>> from mpfunlab import User
>>> Curve = User.Cardioid(a = 1, Resolution = 200, AsPolar = true)
>>> User.Chart2D.Show(Curve, Template = 'PolarCurve', Title = 'Cardioid')
An example in C#
using User;
Curve = User.Cardioid(a: 1, Resolution: 200, AsPolar: true);
User.Chart2D.Show(Curve, Template = "PolarCurve", Title = "Cardioid");
 \(\quad\) \(\quad\)
 Left figure: Heart curve
Middle figure: Heart curve
Right figure: Heart curve
Chrysanthemum curve#
- User.ChrysanthemumCurve(a, Resolution, AsPolar=false)#
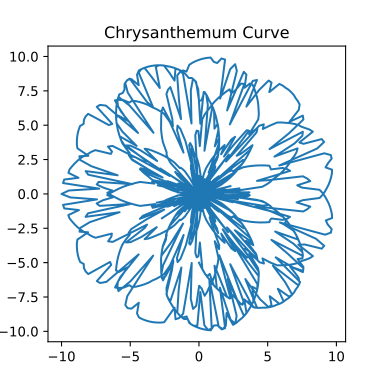
The chrysanthemum curve (see Bourke [38]) is given in polar coordinates by the following
\[r = 5 (1 + \sin(11 t / 5)) - 4 \sin^4(17 t / 3) \sin^8(2 \cos(3 t) - 28 t)\quad \text{where } 0 \le t \le 21 \pi\]and in Cartesian coordinates
\[x = r \cos(t)\]\[y = r \sin(t)\]An example in Python
>>> from mpfunlab import User
>>> Curve = User.Cardioid(a = 1, Resolution = 200, AsPolar = true)
>>> User.Chart2D.Show(Curve, Template = 'PolarCurve', Title = 'Cardioid')
An example in C#
using User;
Curve = User.Cardioid(a: 1, Resolution: 200, AsPolar: true);
User.Chart2D.Show(Curve, Template = "PolarCurve", Title = "Cardioid");
 \(\quad\) \(\quad\)
 Left figure: Chrysanthemum curve
Middle figure: Chrysanthemum curve
Right figure: Chrysanthemum curve
Butterfly curve#
- User.ButterflyCurve(a, Resolution, AsPolar=false)#
See also Wikipedia [1519], MathWorld [1147].
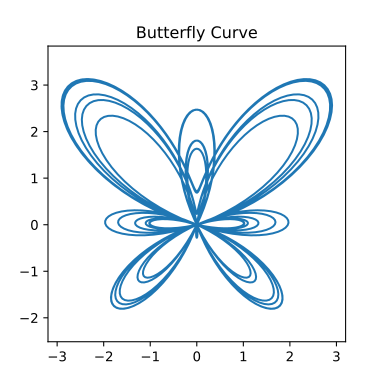
The butterfly curve is given in polar coordinates by the following
\[r = \exp(\cos(t)) - 2 \cos(4t) - \sin^5(t/12)\]and in Cartesian coordinates
\[x = r \cos(t)\]\[y = r \sin(t)\]An example in Python
>>> from mpfunlab import User
>>> Curve = User.Cardioid(a = 1, Resolution = 200, AsPolar = true)
>>> User.Chart2D.Show(Curve, Template = 'PolarCurve', Title = 'Cardioid')
An example in C#
using User;
Curve = User.Cardioid(a: 1, Resolution: 200, AsPolar: true);
User.Chart2D.Show(Curve, Template = "PolarCurve", Title = "Cardioid");
 \(\quad\) \(\quad\)
 Left figure: Butterfly curve
Middle figure: Butterfly curve
Right figure: Butterfly curve