Correlation and regression#
Linear regression with confidence Band#
Some text
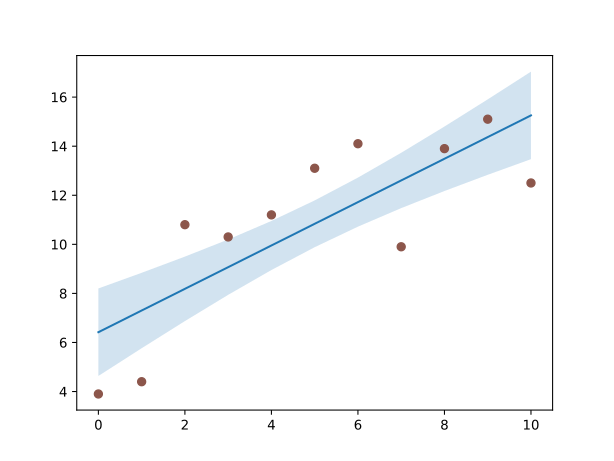
Left figure: Confidence Band
Anscombe example#
Some text
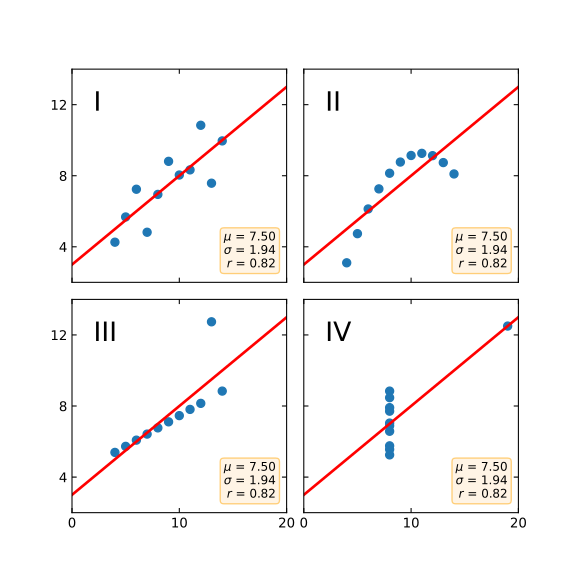
Left figure: Anscombe
Faceted Scatter Plots: all in one plot#
Some text
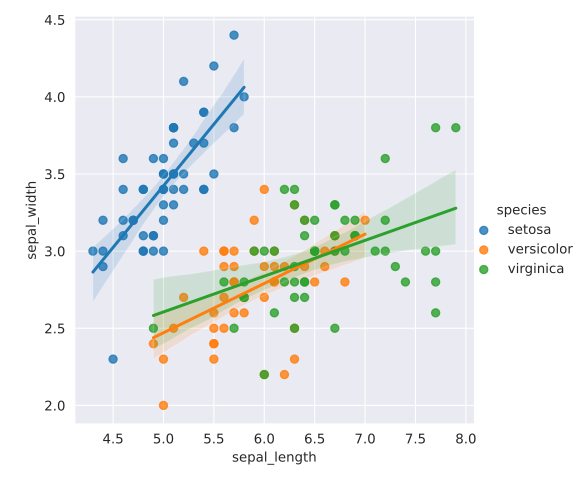
Some text
Faceted Scatter Plots: separate plots#
Some text
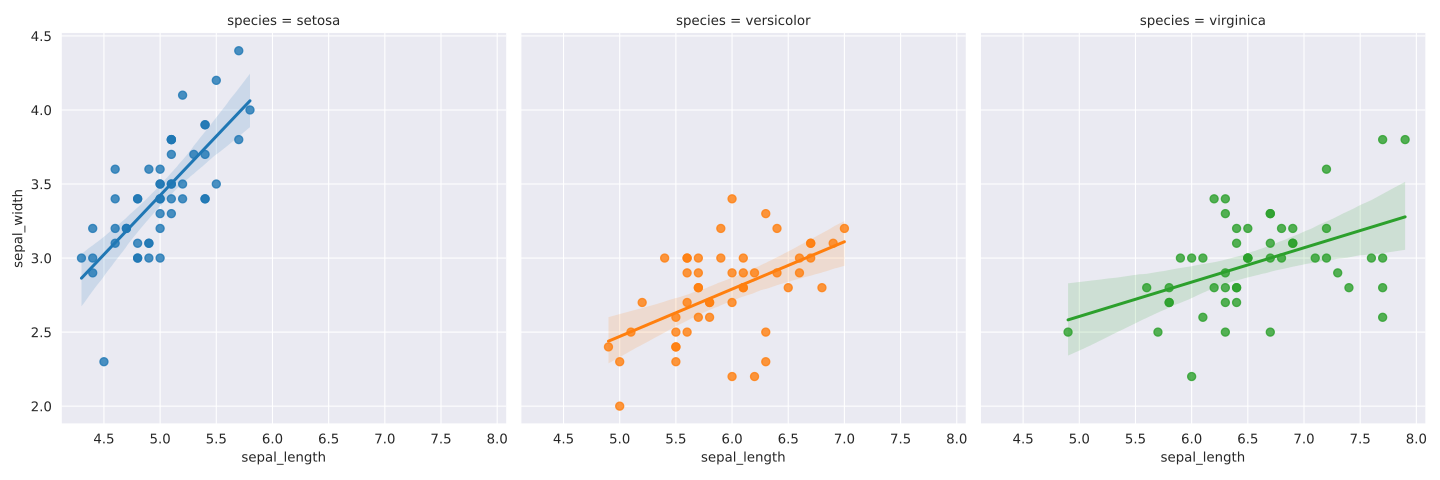
Some text
Faceted Scatter Plots: futher subgrouping#
Some text
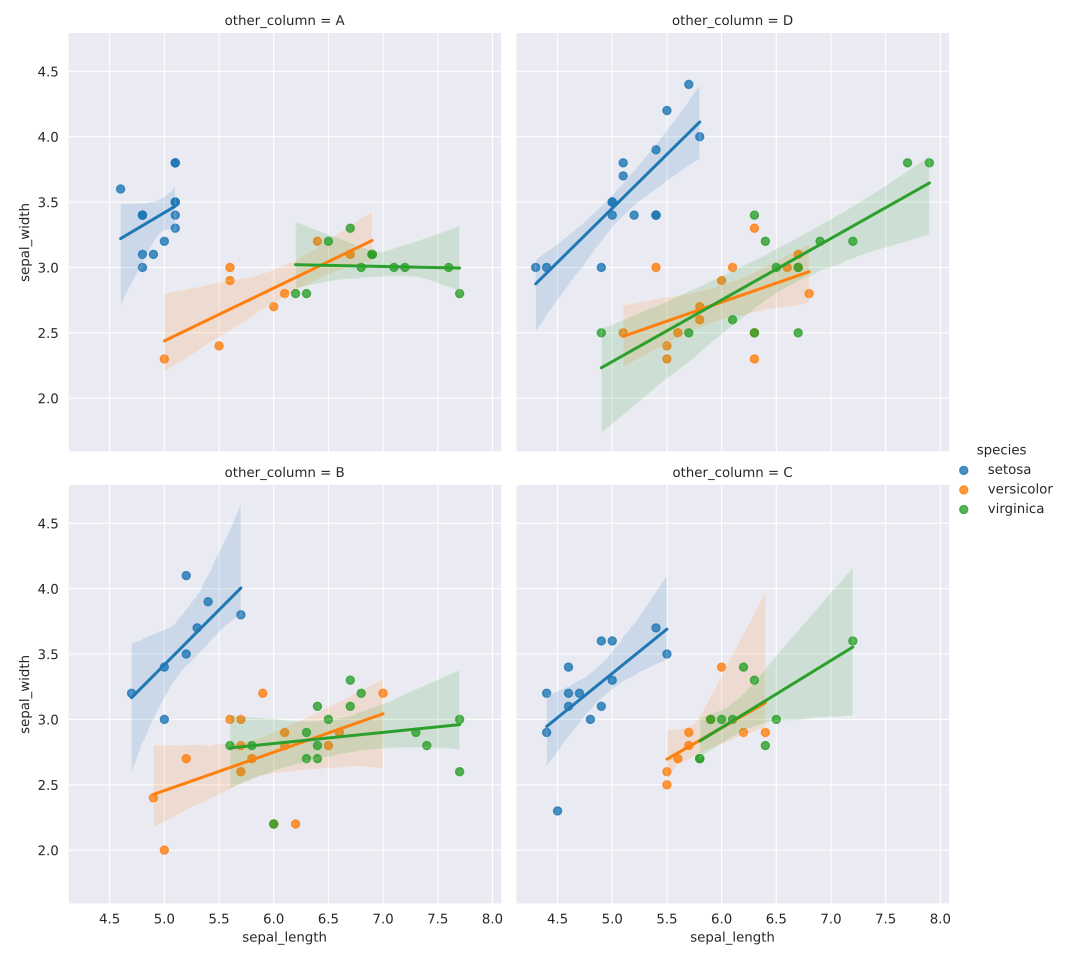
Some text
Bubbleplot#
Some text
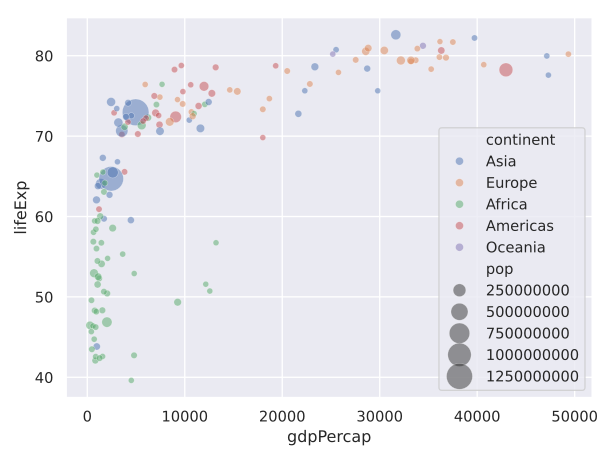
Left figure: Bubble plot
Scatterplot with fancy formatting#
Some text
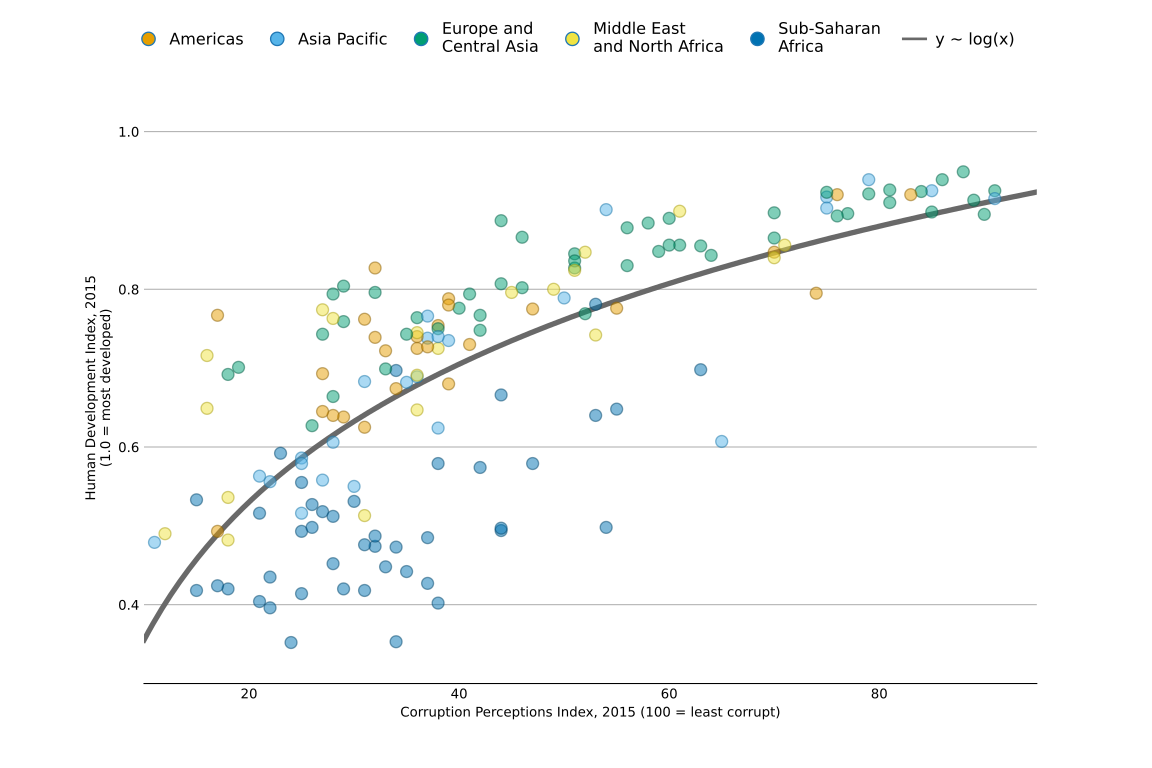
Left figure: Scatterplot Annotation
Scatterplots with positive, negative and weak correlation: confidence ellipses#
Some text
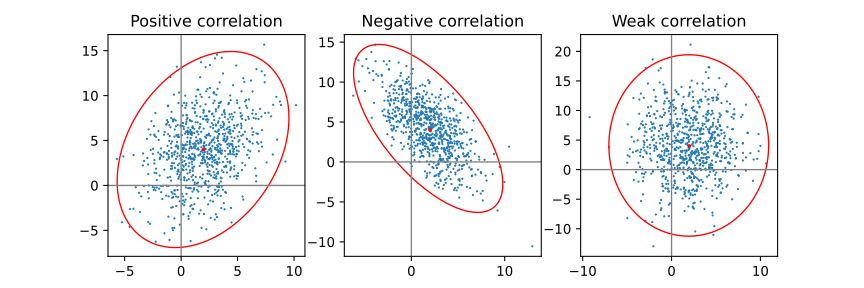
Left figure: Confidence Ellipse
Scatterplot with confidence confidence ellipses at different standard deviations#
Some text
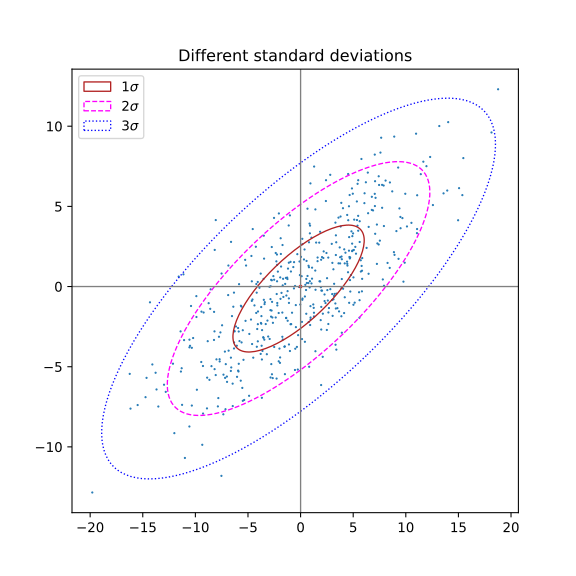
Left figure: Confidence Ellipse 2
Hexagonal binned plot and marginal histograms (Seaborn)#
Some text
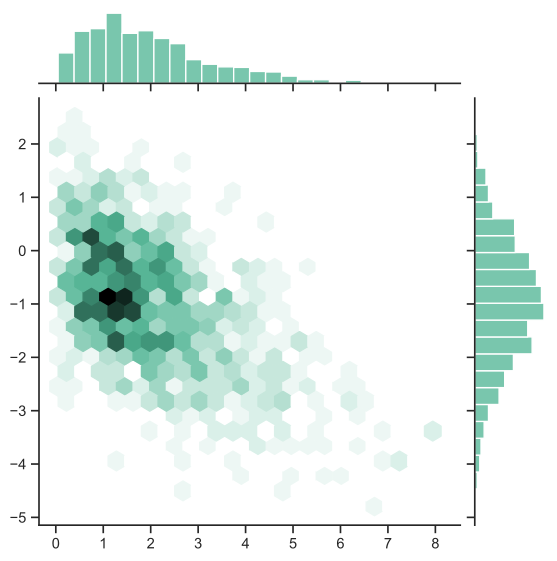
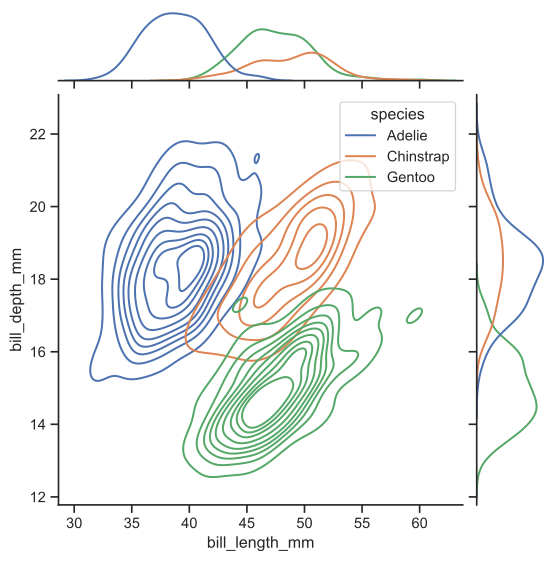
Joint and marginal Kde (Seaborn)#
Some text
Marginal ticks#
Some text
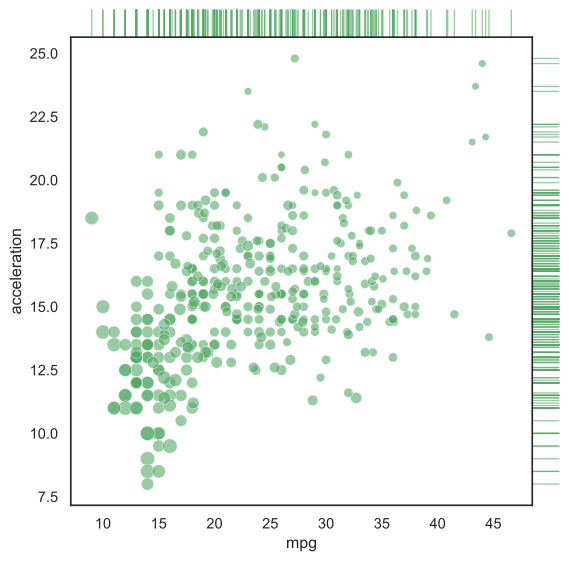
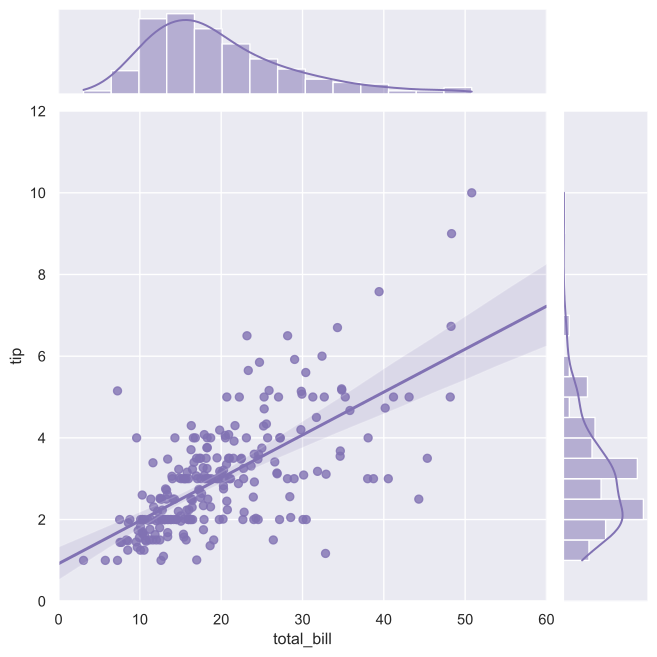
Regression_marginals (Seaborn)#
Some text
Pair grid with kde (Seaborn)#
Some text
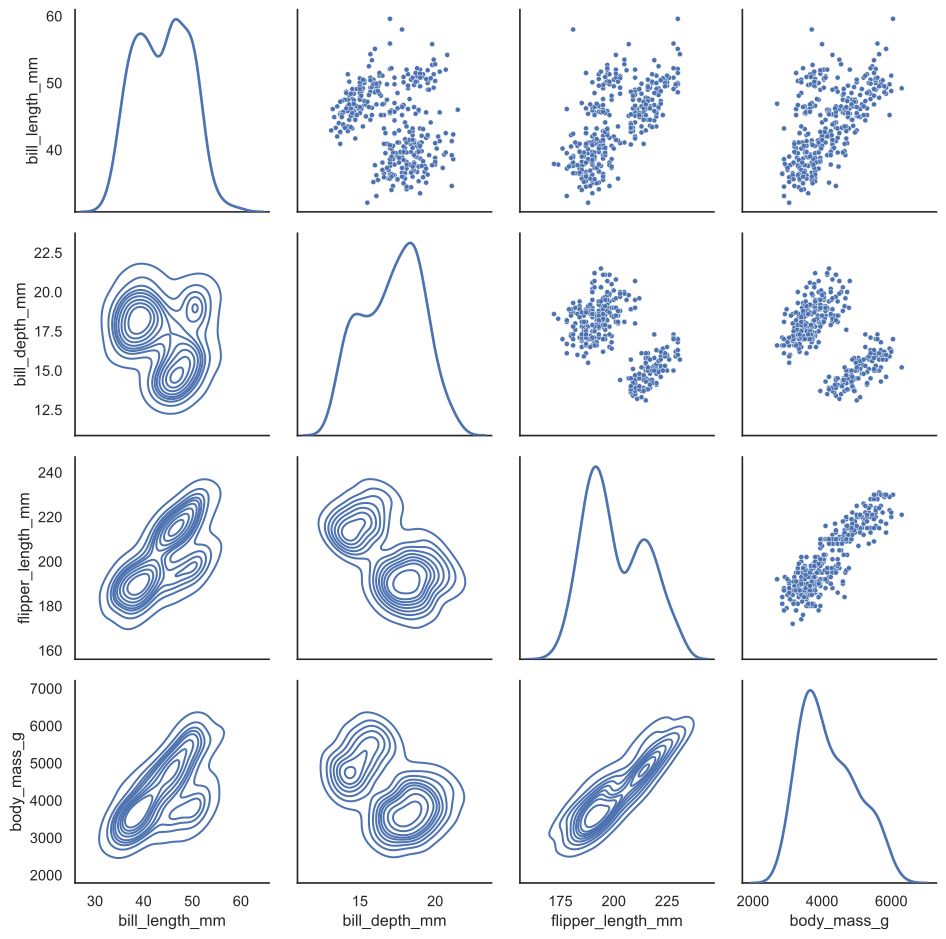
Figure: parametric plot of Kleins bottle. Camera angles are \(\theta=135^\circ\) and \(\phi = -12^\circ\). The C# code for the Klein bottle:
Scatterplot matrix (Seaborn)#
Some text
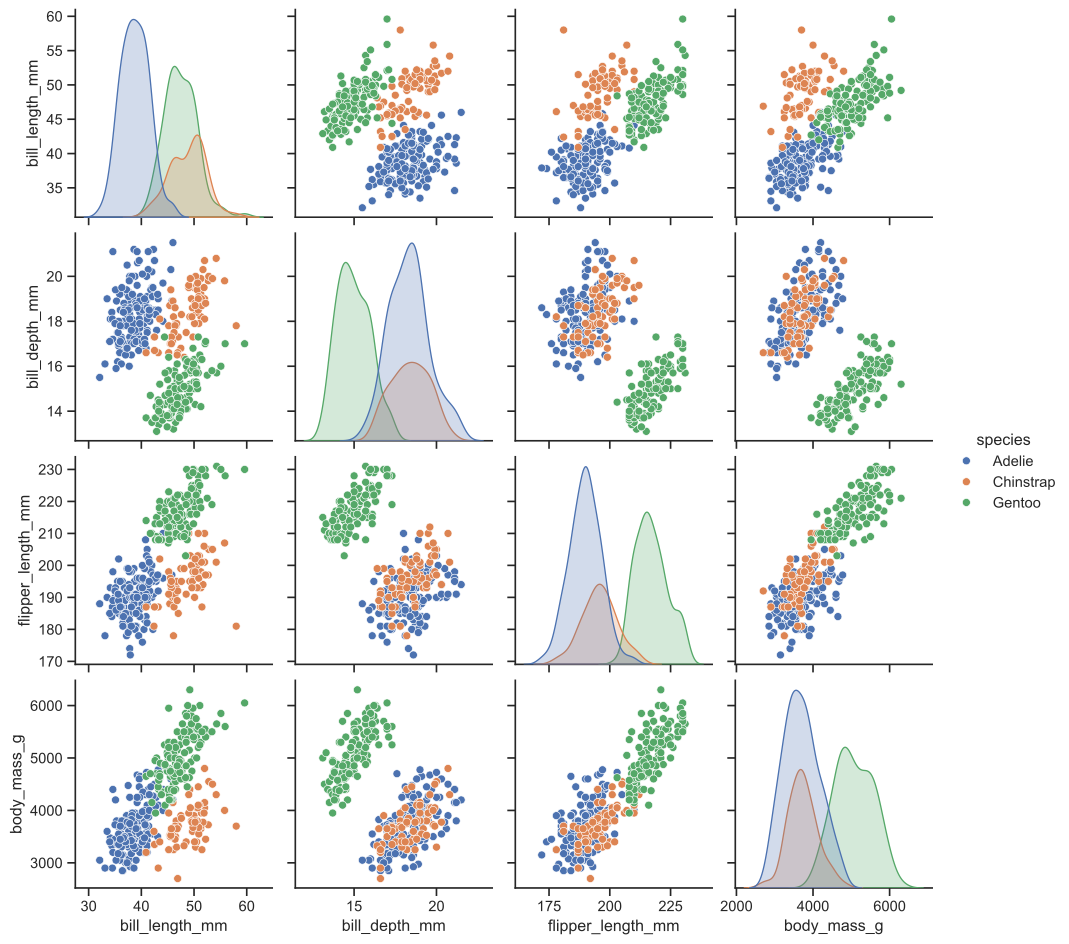
Figure: Scatterplot matrix (Seaborn)